Cuscal Limited (ASX:CCL): Provides payment and regulated data services in Australia, connecting clients to local payments infrastructure.
Ticker code: CCL
Sector: Technology | Industry: Software – Infrastructure | Website: https://www.cuscal.com
Market Information
| Market Capitalisation | Enterprise Value | Shares Outstanding | Free Float [%] | Free Float Value |
|---|---|---|---|---|
| $798,814,610 | -$1,223,085,294 | 191562253.0 | 89.54 | $715,266,590 |
Balance Sheet & Quality
| Equity | Cash | Debt | Return On Equity (ROE) | EBITDA 25 Margin [%] | Net Debt / Equity [%] | Rule of 40 |
|---|---|---|---|---|---|---|
| $376,419,853 | $2,403,899,904 | $382,000,000 | 10.2 | 22.6 | -537.1 | 32.3 |
Technicals & Short Data
| 3EMA Status | Volatility [%] | Value Traded Today | Average Daily Liquidity | Short [%] | Days To Cover |
|---|---|---|---|---|---|
| Positive | 2.4 | $1,632,747 | $1,412,763 | 0.0 | 0.0 |
Dividends
| Previous Dividend | Last Dividend | Franking [%] | Ex-Div Date | Gross Yield [%] |
|---|---|---|---|---|
| None | $0.055 | 100.0 | 2025-08-28 | 0.0 |
Price Performance Snapshot
| Last Traded Price | Change [%] | 1 Week [%] | 1 Month [%] | 3 Months [%] | 6 Months [%] | 12 Months [%] |
|---|---|---|---|---|---|---|
| $4.170 | 1.0 | 2.7 | 6.9 | 37.5 | 70.1 | None |
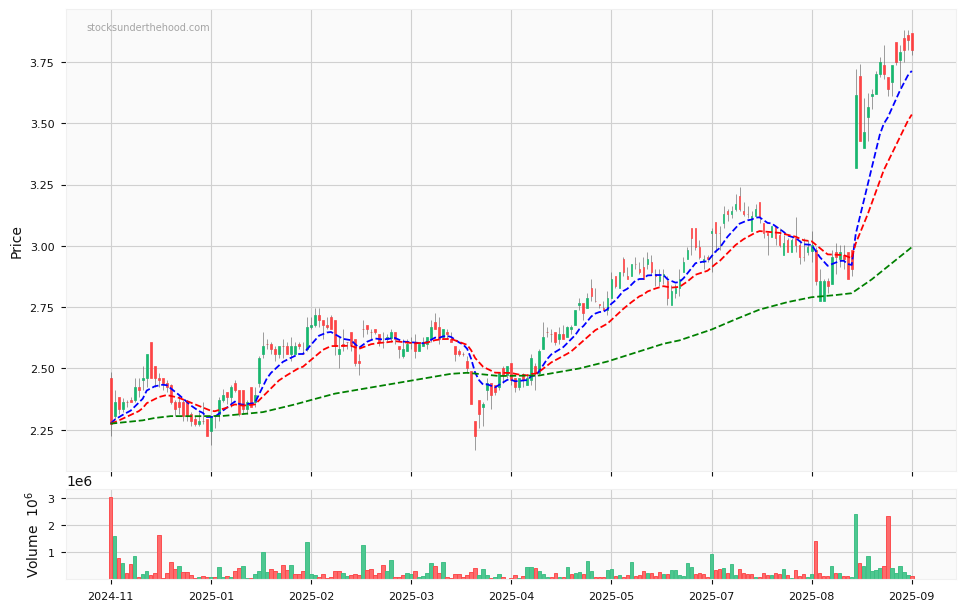
CCL Price Chart with Volume and 3EMA
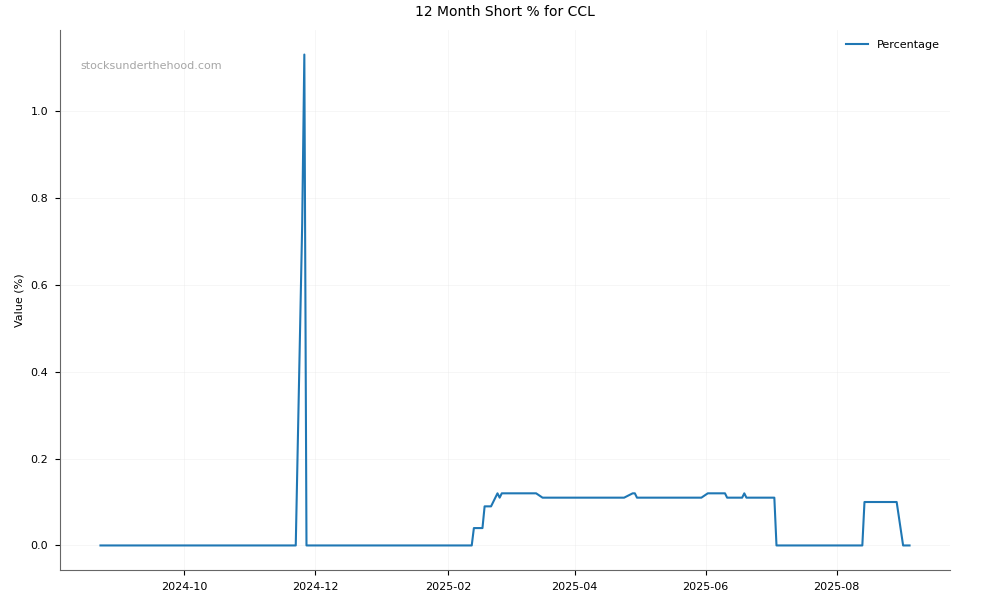
CCL Short Positions
Click HERE to understand why the above moving averages have been chosen.