Ticker code: BRI
BRI Red Flags & Risk Indicators
⚠️
⚠️
⚠️ RED FLAGS: 2 identified
- Falling Revenues
- Falling EBITDA Margins
Income Statement
| Revenue 2024 Per Share | Revenue 2025e Per Share | Revenue 2026e Per Share | Revenue 24 to 25e [%] | Revenue 25e to 26e [%] | EBITDA 2024 Per Share | EBITDA 2025e Per Share | EBITDA 2026e Per Share | EBITDA 24 to 25e [%] | EBITDA 25e to 26e [%] |
|---|---|---|---|---|---|---|---|---|---|
| 4.85786 | 4.74551 | 4.84499 | -2.3 | 2.1 | 0.38167 | 0.33609 | 0.35636 | -11.9 | 6.0 |
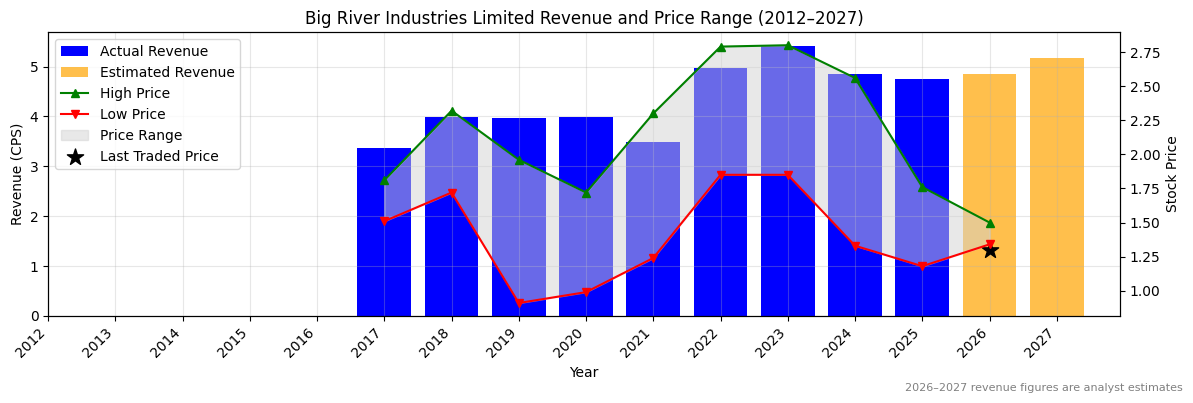
BRI Revenue Per Share (2012–2027)
❌
❌
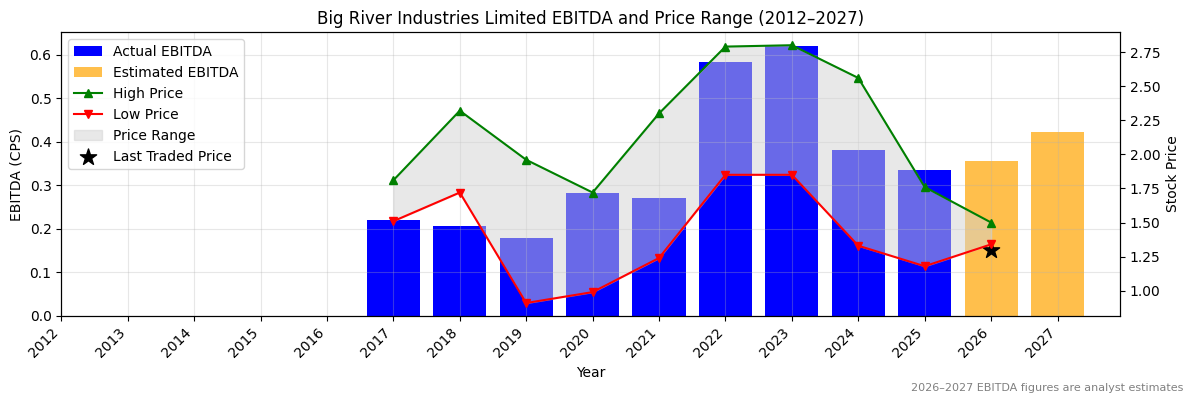
BRI Earnings before Interest, Tax, Depreciation and Amortisation (EBITDA) Per Share (2012–2027)
❌
❌
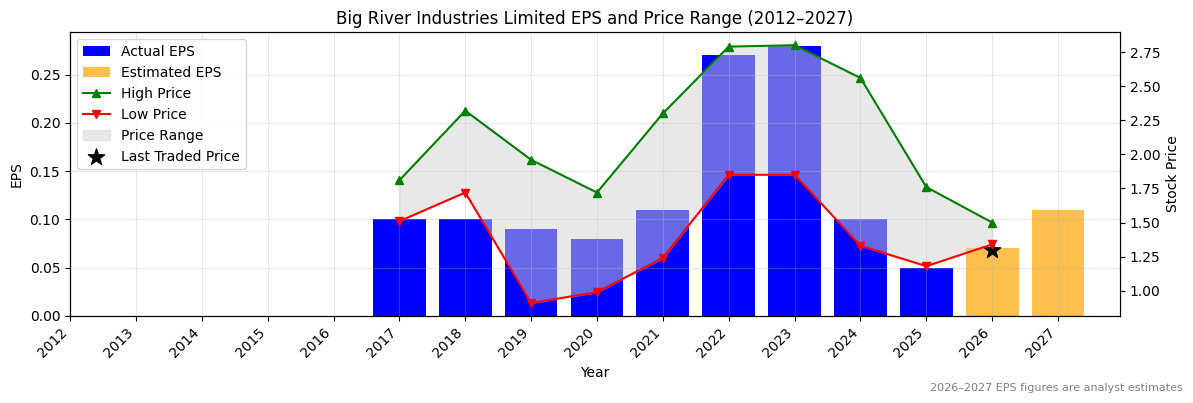
BRI Normalised Earnings Per Share (EPS) (2012–2027)
❌
❌
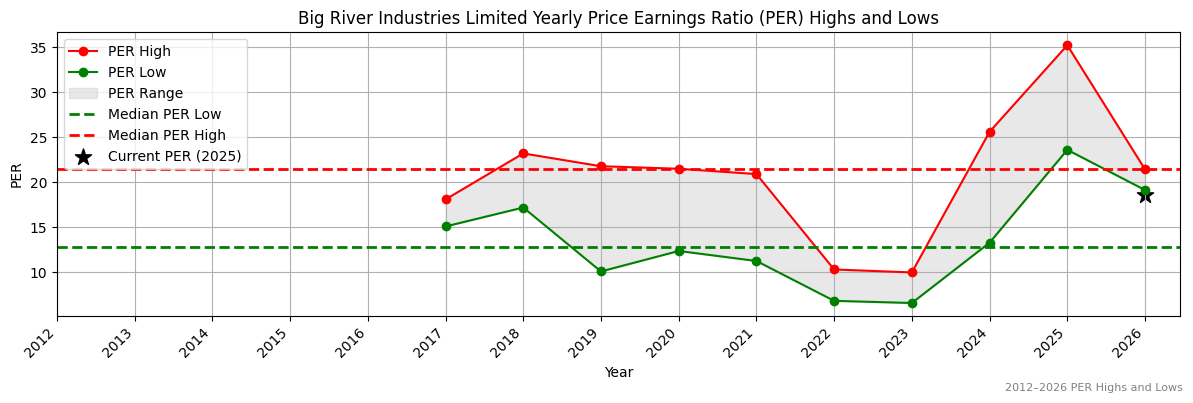
Valuation
| Price To Sales | Price To Book | PER 2023 | PER 2024 | 13Y Median PER Low | PER 2025e | 13Y Median PER High | PER 2026e | Last Updated |
|---|---|---|---|---|---|---|---|---|
| 0.3 | 1.2 | 5.1 | 14.3 | 12.8 | 28.7 | 21.5 | 20.5 | 3/9/25 |
BRI Yearly Price Earnings Ratio (PER) Highs and Lows
❌
❌
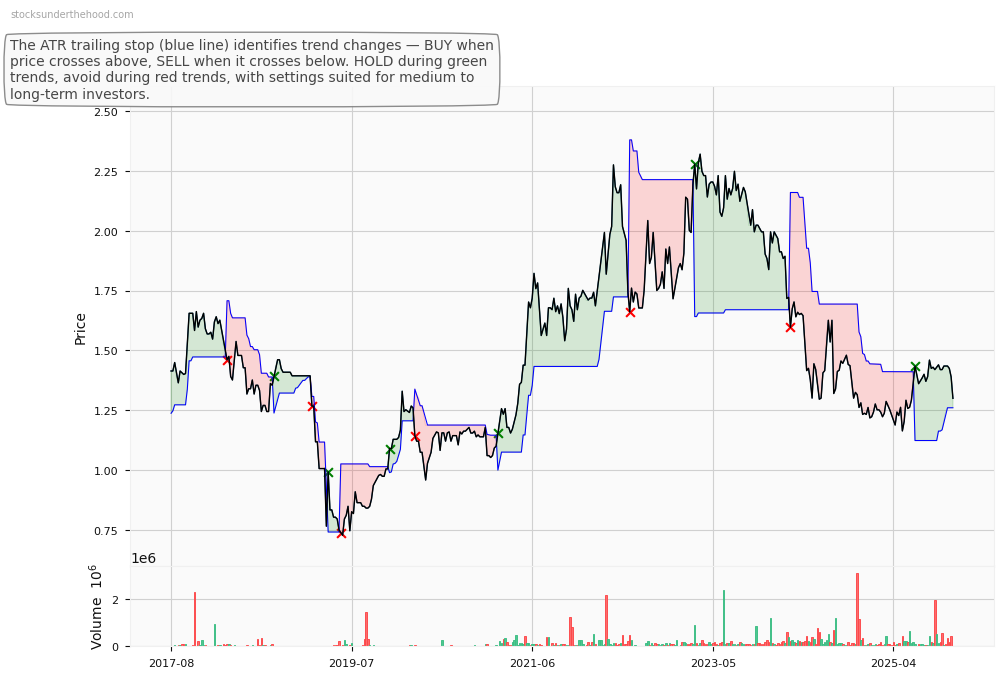
BRI Weekly Price Chart with Average True Range (ATR) Trailing Stop (10-Year View)