Ticker code: ASX:C79
ASX:C79 Red Flags & Risk Indicators
⚠️
⚠️
⚠️ RED FLAGS: 2 identified
- High Price to Book vs ROE
- High Relative Valuation
Income Statement
| Revenue 2024 Per Share | Revenue 2025e Per Share | Revenue 2026e Per Share | Revenue 24 to 25e [%] | Revenue 25e to 26e [%] | EBITDA 2024 Per Share | EBITDA 2025e Per Share | EBITDA 2026e Per Share | EBITDA 24 to 25e [%] | EBITDA 25e to 26e [%] |
|---|---|---|---|---|---|---|---|---|---|
| 0.39444 | 0.5737 | 0.75298 | 45.4 | 31.3 | 0.07783 | 0.13851 | 0.21821 | 78.0 | 57.5 |
ASX:C79 Revenue Per Share (2012–2027)
✅✅
✅✅

ASX:C79 Earnings before Interest, Tax, Depreciation and Amortisation (EBITDA) Per Share (2012–2027)
✅✅
✅✅

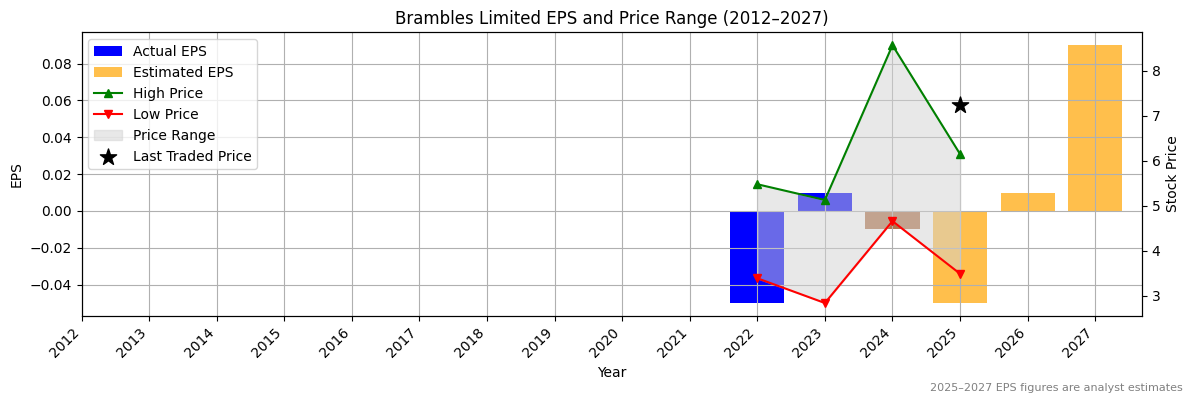
ASX:C79 Normalised Earnings Per Share (EPS) (2012–2027)
❌
❌
Valuation
| Price To Sales | Price To Book | PER 2023 | PER 2024 | 13Y Median PER Low | PER 2025e | 13Y Median PER High | PER 2026e | Last Updated |
|---|---|---|---|---|---|---|---|---|
| 12.8 | 4.3 | 725.0 | -725.0 | 284.0 | -145.0 | 513.0 | 725.0 | 17/8/25 |
ASX:C79 Yearly Price Earnings Ratio (PER) Highs and Lows
✅✅
✅✅

ASX:C79 Weekly Price Chart with Average True Range (ATR) Trailing Stop (10-Year View)
