Ticker code: LYC
LYC Red Flags & Risk Indicators
❌
❌
⚠️ RED FLAGS: 4 identified
- Falling Earnings
- High Price to Book vs ROE
- High Relative Valuation
- Falling EBITDA Margins
Income Statement
| Revenue 2024 Per Share | Revenue 2025e Per Share | Revenue 2026e Per Share | Revenue 24 to 25e [%] | Revenue 25e to 26e [%] | EBITDA 2024 Per Share | EBITDA 2025e Per Share | EBITDA 2026e Per Share | EBITDA 24 to 25e [%] | EBITDA 25e to 26e [%] |
|---|---|---|---|---|---|---|---|---|---|
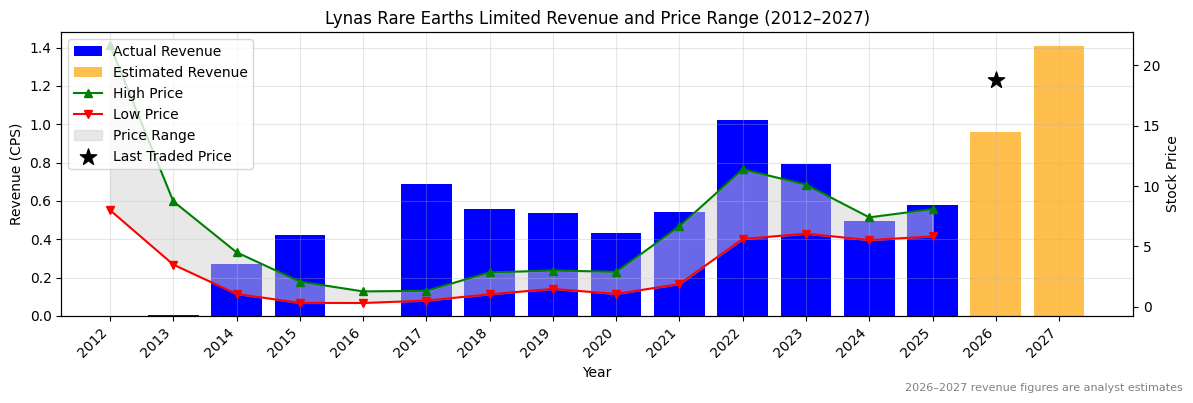
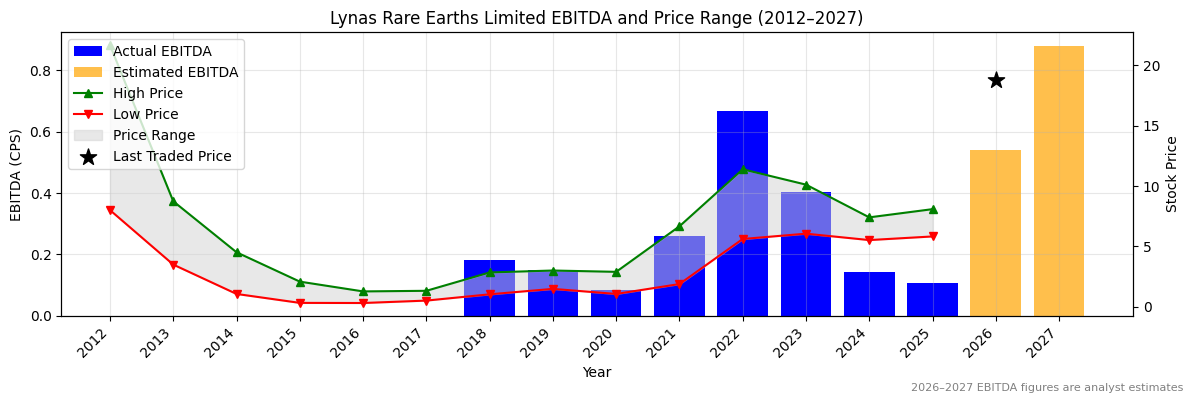
| 0.49613 | 0.57979 | 0.96124 | 16.9 | 65.8 | 0.1415 | 0.10836 | 0.54074 | -23.4 | 399.0 |
LYC Revenue Per Share (2012–2027)
✅
✅
LYC Earnings before Interest, Tax, Depreciation and Amortisation (EBITDA) Per Share (2012–2027)
❌
❌
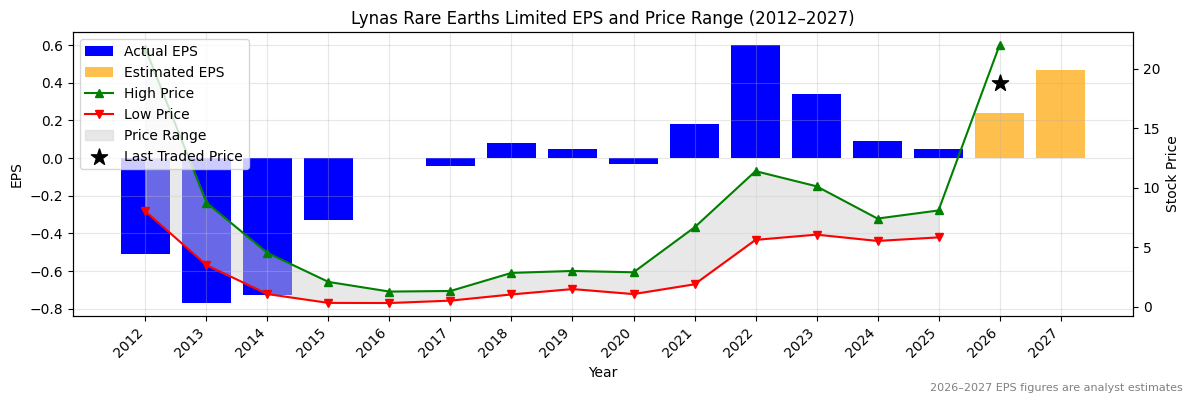
LYC Normalised Earnings Per Share (EPS) (2012–2027)
❌
❌
Valuation
| Price To Sales | Price To Book | PER 2023 | PER 2024 | 13Y Median PER Low | PER 2025e | 13Y Median PER High | PER 2026e | Last Updated |
|---|---|---|---|---|---|---|---|---|
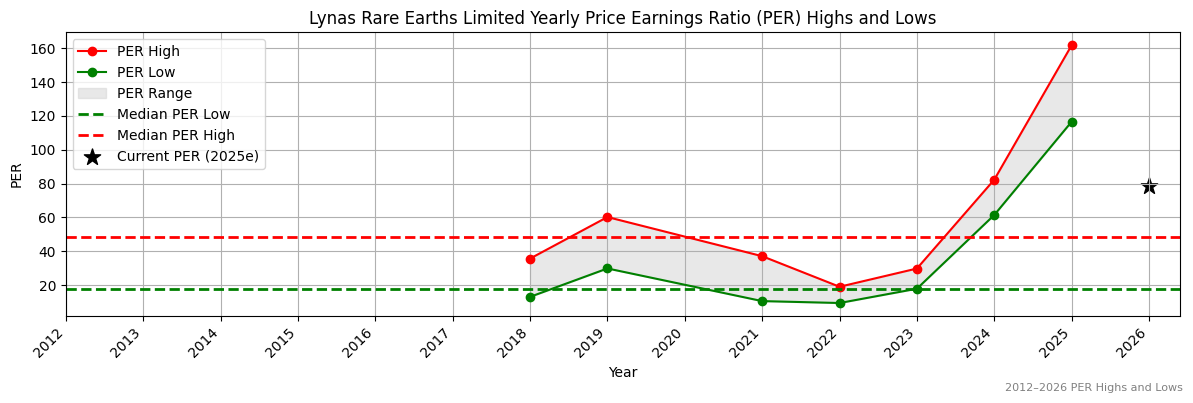
| 34.0 | 7.5 | 55.4 | 209.1 | 17.8 | 376.4 | 48.6 | 78.4 | 4/10/25 |
LYC Yearly Price Earnings Ratio (PER) Highs and Lows
❌
❌
LYC Weekly Price Chart with Average True Range (ATR) Trailing Stop (10-Year View)
