Ticker code: NWL
NWL Red Flags & Risk Indicators
⚠️
⚠️
⚠️ RED FLAGS: 1 identified
- Increasing Shorts
Income Statement
| Revenue 2024 Per Share | Revenue 2025e Per Share | Revenue 2026e Per Share | Revenue 24 to 25e [%] | Revenue 25e to 26e [%] | EBITDA 2024 Per Share | EBITDA 2025e Per Share | EBITDA 2026e Per Share | EBITDA 24 to 25e [%] | EBITDA 25e to 26e [%] |
|---|---|---|---|---|---|---|---|---|---|
| 1.04597 | 1.32665 | 1.58075 | 26.8 | 19.2 | 0.51092 | 0.66729 | 0.79997 | 30.6 | 19.9 |
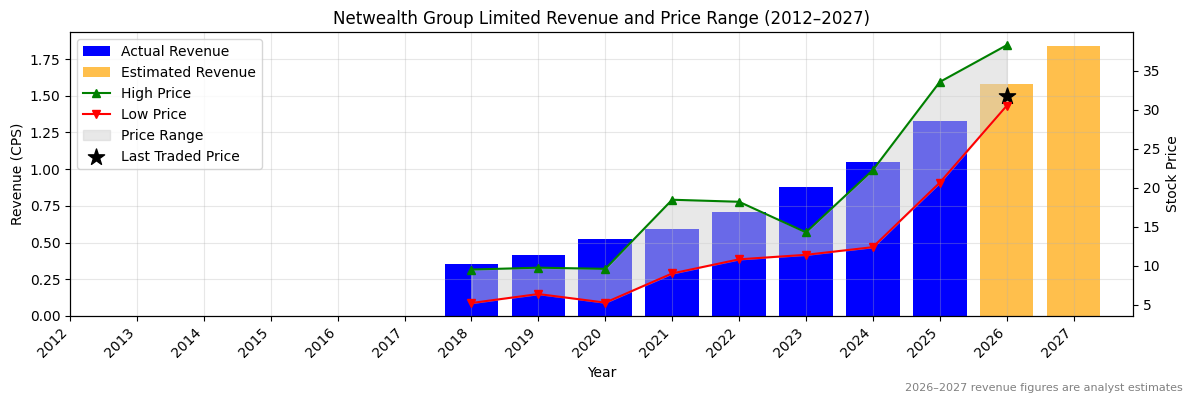
NWL Revenue Per Share (2012–2027)
✅✅
✅✅
NWL Earnings before Interest, Tax, Depreciation and Amortisation (EBITDA) Per Share (2012–2027)
✅✅
✅✅

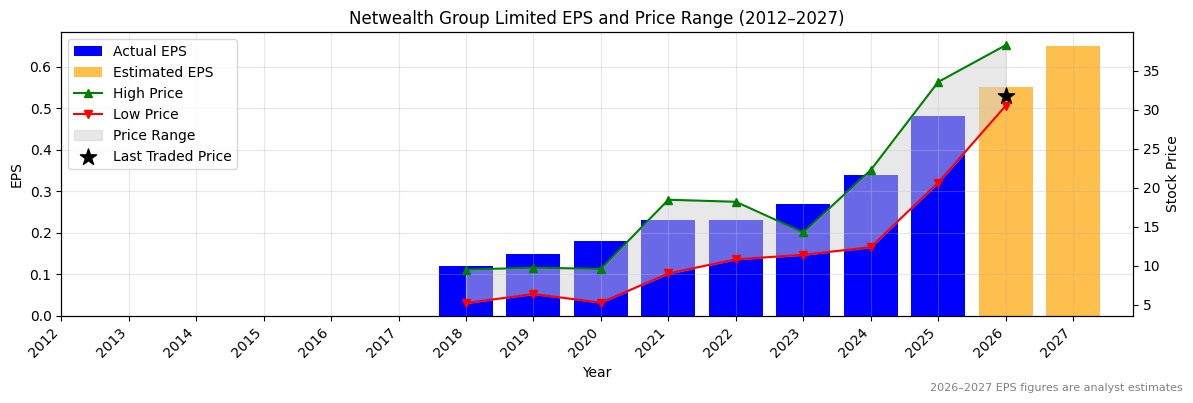
NWL Normalised Earnings Per Share (EPS) (2012–2027)
✅✅
✅✅
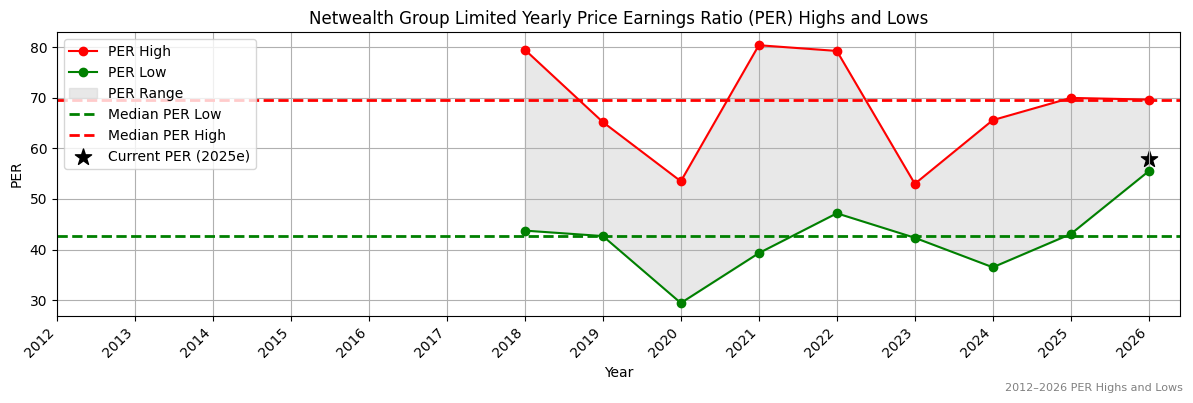
Valuation
| Price To Sales | Price To Book | PER 2023 | PER 2024 | 13Y Median PER Low | PER 2025e | 13Y Median PER High | PER 2026e | Last Updated |
|---|---|---|---|---|---|---|---|---|
| 24.1 | 39.2 | 117.9 | 93.6 | 42.7 | 66.3 | 69.6 | 57.9 | 14/9/25 |
NWL Yearly Price Earnings Ratio (PER) Highs and Lows
✅
✅
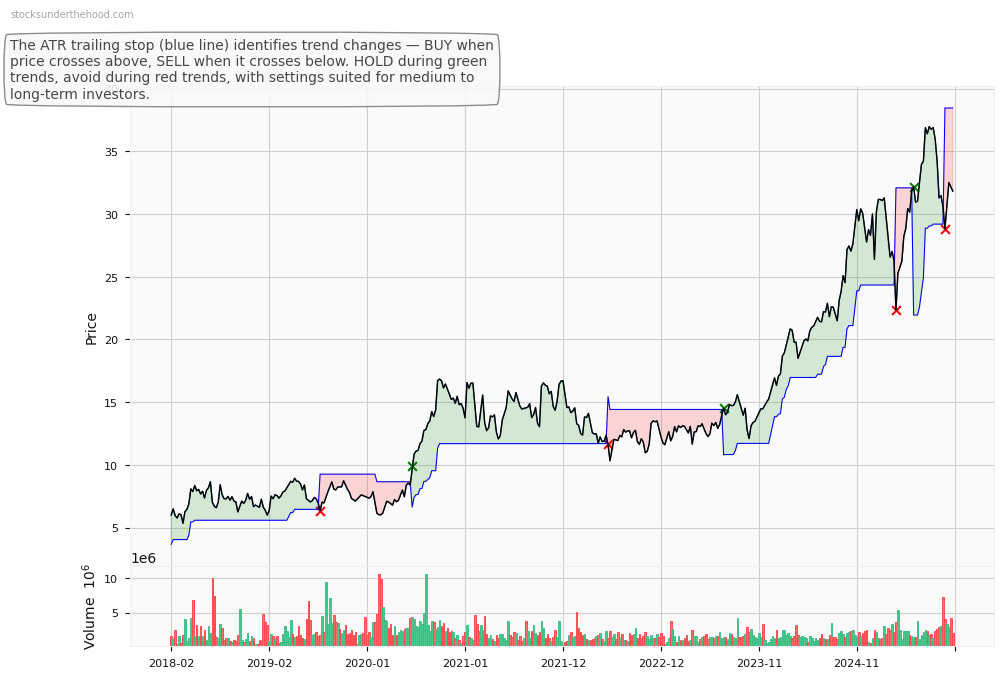
NWL Weekly Price Chart with Average True Range (ATR) Trailing Stop (10-Year View)