Ticker code: PLTR
PLTR Red Flags & Risk Indicators
⚠️
⚠️
⚠️ RED FLAGS: 1 identified
- High Relative Valuation
Income Statement
| Revenue 2024 Per Share | Revenue 2025e Per Share | Revenue 2026e Per Share | Revenue 24 to 25e [%] | Revenue 25e to 26e [%] | EBITDA 2024 Per Share | EBITDA 2025e Per Share | EBITDA 2026e Per Share | EBITDA 24 to 25e [%] | EBITDA 25e to 26e [%] |
|---|---|---|---|---|---|---|---|---|---|
| 1.22667 | 1.52631 | 1.85921 | 24.4 | 21.8 | 0.47637 | 0.60103 | 0.74422 | 26.2 | 23.8 |
PLTR Revenue Per Share (2012–2027)
✅✅
✅✅

PLTR Earnings before Interest, Tax, Depreciation and Amortisation (EBITDA) Per Share (2012–2027)
✅✅
✅✅

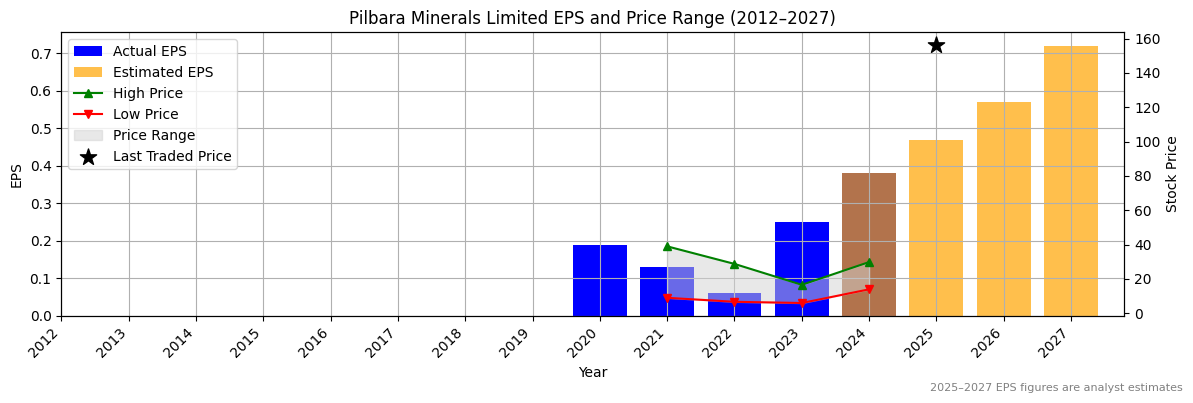
PLTR Normalised Earnings Per Share (EPS) (2012–2027)
✅✅
✅✅
Valuation
| Price To Sales | Price To Book | PER 2023 | PER 2024 | 13Y Median PER Low | PER 2025e | 13Y Median PER High | PER 2026e | Last Updated |
|---|---|---|---|---|---|---|---|---|
| 127.3 | 73.9 | 738.5 | 485.9 | 69.5 | 392.8 | 300.0 | 323.9 | 21/4/25 |
PLTR Yearly Price Earnings Ratio (PER) Highs and Lows
❌
❌

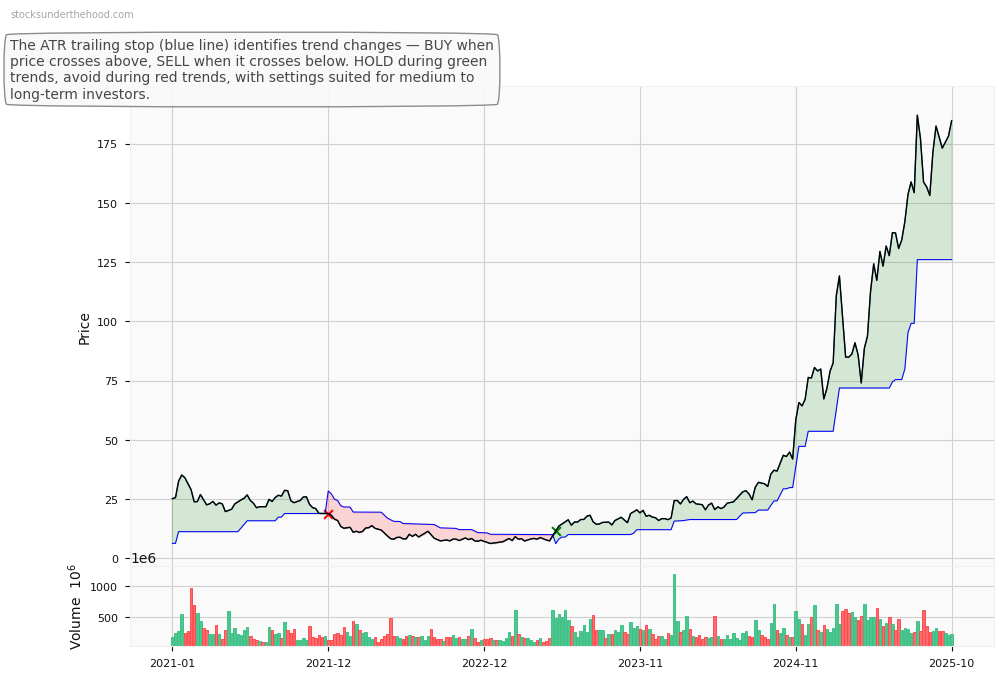
PLTR Weekly Price Chart with Average True Range (ATR) Trailing Stop (10-Year View)