Ticker code: RUL
RUL Red Flags & Risk Indicators
❌
❌
⚠️ RED FLAGS: 6 identified
- Negative Operating Cash Flow
- Increasing Shorts
- Falling Earnings
- Falling Revenues
- High Relative Valuation
- Falling EBITDA Margins
Income Statement
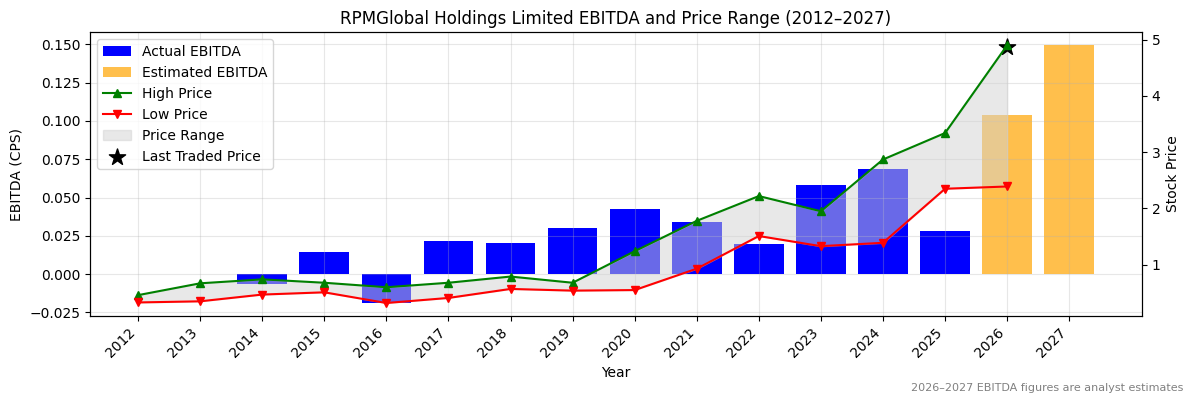
| Revenue 2024 Per Share | Revenue 2025e Per Share | Revenue 2026e Per Share | Revenue 24 to 25e [%] | Revenue 25e to 26e [%] | EBITDA 2024 Per Share | EBITDA 2025e Per Share | EBITDA 2026e Per Share | EBITDA 24 to 25e [%] | EBITDA 25e to 26e [%] |
|---|---|---|---|---|---|---|---|---|---|
| 0.50748 | 0.53739 | 0.40495 | 5.9 | -24.6 | 0.06852 | 0.02809 | 0.10383 | -59.0 | 269.7 |
RUL Revenue Per Share (2012–2027)
✅
✅

RUL Earnings before Interest, Tax, Depreciation and Amortisation (EBITDA) Per Share (2012–2027)
❌
❌
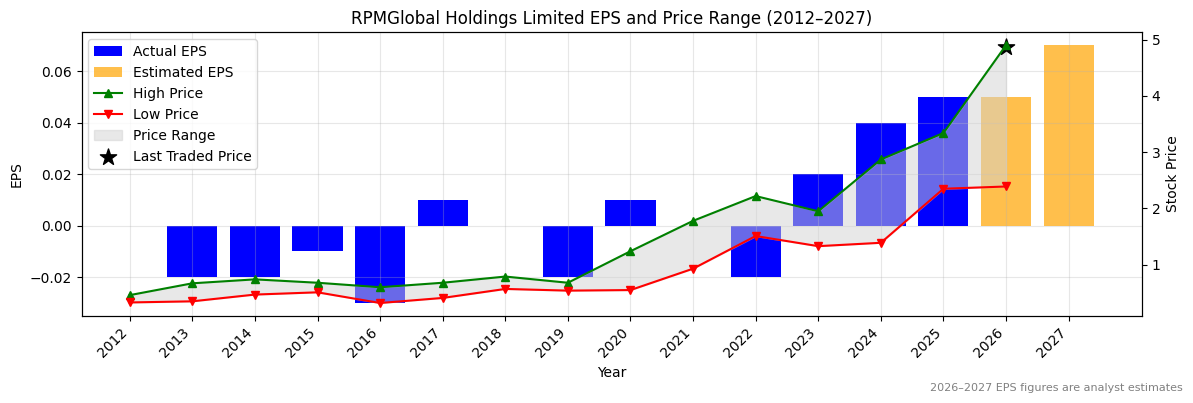
RUL Normalised Earnings Per Share (EPS) (2012–2027)
✅✅
✅✅
Valuation
| Price To Sales | Price To Book | PER 2023 | PER 2024 | 13Y Median PER Low | PER 2025e | 13Y Median PER High | PER 2026e | Last Updated |
|---|---|---|---|---|---|---|---|---|
| 14.6 | 11.6 | 243.0 | 121.5 | 47.4 | 97.2 | 84.6 | 97.2 | 4/10/25 |
RUL Yearly Price Earnings Ratio (PER) Highs and Lows
❌
❌

RUL Weekly Price Chart with Average True Range (ATR) Trailing Stop (10-Year View)
