Dyno Nobel Limited is a global industrial chemicals company manufacturing and distributing fertilizers, explosives, and industrial chemicals for the agriculture and mining industries.
Ticker code: DNL
Sector: Basic Materials | Industry: Specialty Chemicals | Website: https://www.dynonobel.com.au
Market Information
| Market Capitalisation | Enterprise Value | Shares Outstanding | Free Float [%] | Free Float Value |
|---|---|---|---|---|
| $5,906,773,884 | $7,316,073,852 | 1795372022 | 94.06 | $5,556,197,963 |
Balance Sheet & Quality
| Equity | Cash | Debt | Return On Equity (ROE) | EBITDA 25 Margin [%] | Net Debt / Equity [%] | Rule of 40 |
|---|---|---|---|---|---|---|
| $4,644,627,119 | $557,200,000 | $1,966,499,968 | 7.4 | None | 30.3 | None |
Technicals & Short Data
| 3EMA Status | Volatility [%] | Value Traded Today | Average Daily Liquidity | Short [%] | Days To Cover |
|---|---|---|---|---|---|
| Positive | 1.7 | $11,189,530 | $14,429,272 | 0.36 | 1.5 |
Dividends
| Previous Dividend | Last Dividend | Franking [%] | Ex-Div Date | Gross Yield [%] |
|---|---|---|---|---|
| None | $0.024 | 55.0 | 2025-06-13 | 0.0 |
Price Performance Snapshot
| Last Traded Price | Change [%] | 1 Week [%] | 1 Month [%] | 3 Months [%] | 6 Months [%] | 12 Months [%] |
|---|---|---|---|---|---|---|
| $3.290 | 1.2 | 1.2 | 7.2 | 12.3 | 43.1 | 10.8 |
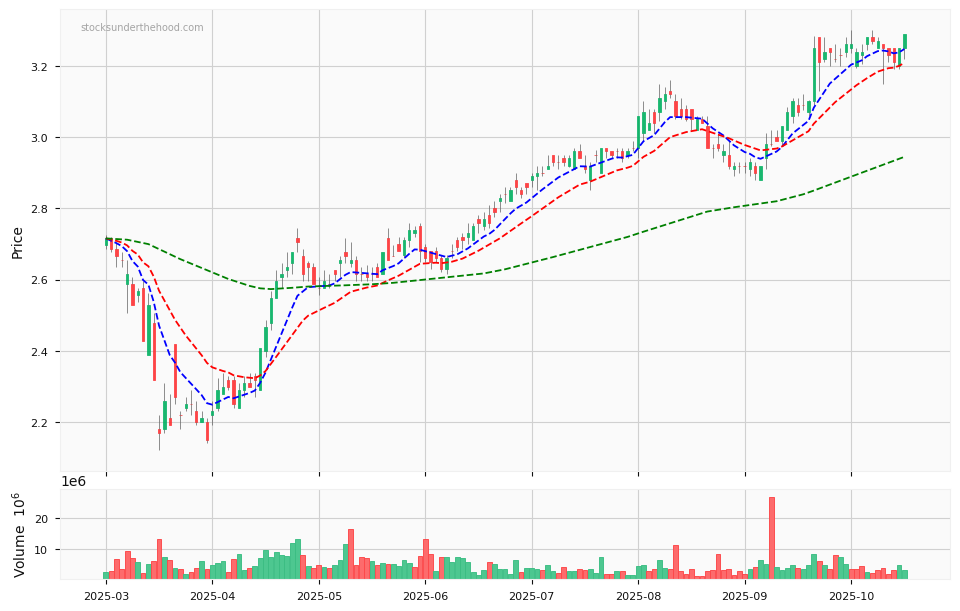
DNL Price Chart with Volume and 3EMA
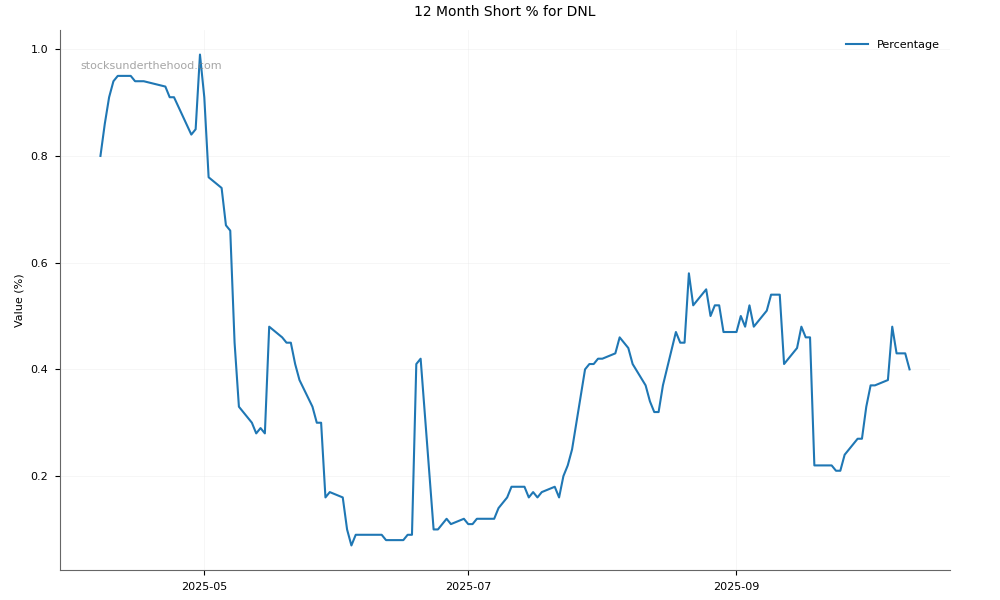
DNL Short Positions
Click HERE to understand why the above moving averages have been chosen.