📅 June, 2025
🌐 Website: www.catapult.com
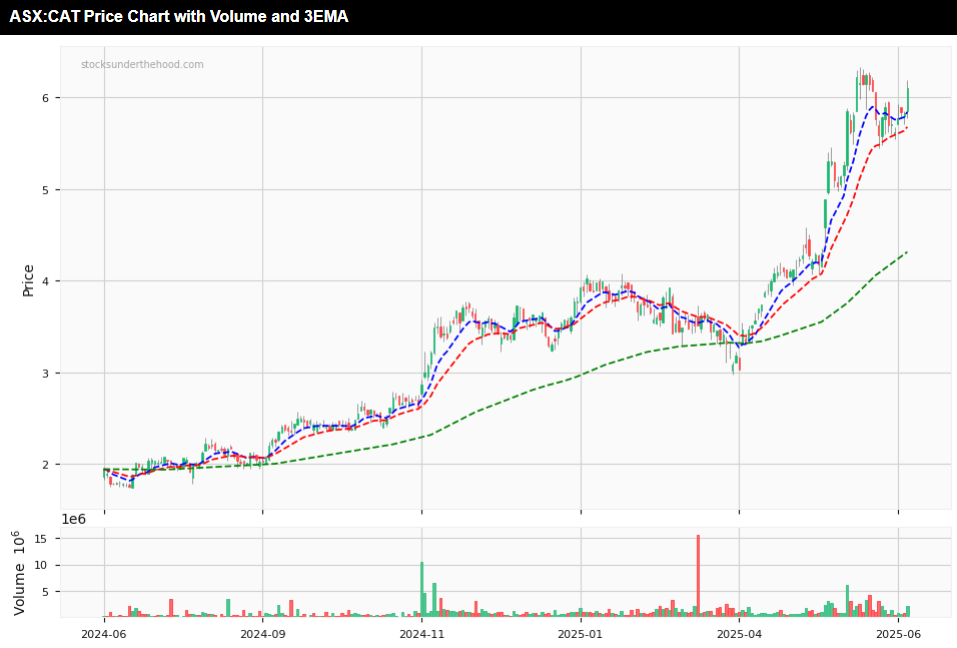
Here is a forensic financial analysis of Catapult (ASX:CAT), based on its FY25 Annual Report.
📊 Balance Sheet
| Risk Indicator | Status | Comments |
|---|---|---|
| Goodwill >25% of Assets | ✅ | No explicit disclosure indicating goodwill dominance; likely under threshold given SaaS model and modest acquisition activity. |
| Rising Receivables Days | 🟠 | Receivables growth implied by ACV and revenue growth; no explicit receivables days trend disclosed—warrants monitoring as revenue expands rapidly. |
| Inventory Growth vs Profit | Not Applicable | SaaS business—minimal inventories, but capital equipment sales (~6% of revenue) could create deferred recognition risk. |
| High Borrowings | ✅ | Debt reduced significantly to $3.5M (from $11M), net cash position of ~$7M. Low leverage. |
| Loans to Related Parties | ✅ | No evidence of related party loans disclosed. |
| Idle Cash | ✅ | Cash position adequate ($10.7M) and reducing borrowings—no indication of hoarding. |
📈 Income Statement
| Risk Indicator | Status | Comments |
|---|---|---|
| Revenue vs Profit Divergence | 🟠 | Revenue +16.5%, Management EBITDA margin improved to 12.7%, but still net loss ($8.8M). Improving trend but not fully profitable at statutory level. |
| Capitalised R&D/Interest | 🔴 | Significant capitalised development: $16.7M (~14% of revenue). This is material and flat YoY, supporting profit margins—requires close scrutiny. |
| Extraordinary Items | ✅ | No recurring extraordinary items disclosed. |
| Tax Rate Drop | ✅ | Loss-making entity—no abnormal tax benefits disclosed. |
| Profit vs Cash Flow | ✅ | Free Cash Flow improved materially to +$8.6M from +$4.6M. Cash flow moving positive. |
| One-Off Gains Boosting Profit | ✅ | No asset revaluations or disposals used to boost earnings. |
🏛️ Governance, Disclosure & Audit
| Risk Indicator | Status | Comments |
|---|---|---|
| Auditor Changes | ✅ | No auditor changes reported. |
| Audit Qualifications | ✅ | No qualifications noted in the audit opinion. |
| Exec Departures | ✅ | Stable leadership, no major CEO/CFO turnover. |
| Transparency Issues | 🟠 | Heavy reliance on non-IFRS metrics (Management EBITDA, ACV). Clear definitions provided but high non-IFRS usage warrants caution. |
| Board Weakness | ✅ | Board appears experienced, no independence concerns noted. |
| Executive Pay Misalignment | 🟠 | Share-based payments remain material ($12.5M), dilutive incentives persist despite statutory losses. |
| Promotional Language | 🟠 | Marketing-heavy language (“unleash potential,” “category-defining”)—some caution on optimism bias. |
🧠 Strategic Risk Factors
| Risk Indicator | Status | Comments |
|---|---|---|
| Chronic Unprofitability | 🟠 | Still net loss-making, but trend improving with positive FCF. |
| Revenue < Capex | ✅ | Capex mainly R&D; total capex not exceeding revenue. |
| Funding Dependency | ✅ | No new equity raises disclosed in FY25; reduced borrowings. |
| Customer Concentration | ✅ | No material concentration disclosed. |
| Pre-commercial Product Risk | ✅ | Core products commercialised and scaling. |
| Short Cash Runway | ✅ | Net cash positive; free cash flow positive; no immediate runway concerns. |
| Regulatory/Compliance Exposure | 🟠 | Trademark litigation with Adidas in the US—stated immaterial but worth monitoring. |
| Leadership Turnover During Expansion | ✅ | No turnover reported during scaling period. |
✅ Final Summary
| Category | 🔴 Red Flags | 🟠 Amber Flags |
|---|---|---|
| Balance Sheet | 0 | 1 |
| Income Statement | 1 | 1 |
| Governance / Disclosure | 0 | 3 |
| Strategic Risk Factors | 0 | 2 |
🔴 Total Red Flags: 1
🟠 Total Amber Flags: 7
🟠 Amber & 🔴 Red Flag Overview
- 🔴 Capitalised R&D/Interest: $16.7M capitalised development costs represent 14% of revenue—material support to margins.
- 🟠 Rising Receivables Days: Receivables growth may lag collections as ACV expands; trend data needed.
- 🟠 Revenue vs Profit Divergence: Revenue growth strong but still net statutory losses, though improving trajectory.
- 🟠 Transparency Issues: Heavy reliance on pro forma/non-IFRS metrics.
- 🟠 Executive Pay Misalignment: High share-based payments ($12.5M) dilute despite net losses.
- 🟠 Promotional Language: Very promotional tone; some caution warranted.
- 🟠 Regulatory/Compliance Exposure: Adidas trademark opposition in the US—management believes immaterial but worth watching.
- 🟠 Chronic Unprofitability: Net losses persist, albeit with improving trend.
Disclaimer: This information is provided purely for educational purposes. It takes no account of an individual’s personal financial circumstances and hence can in no way constitute financial advice. The above data may be subject to errors or inconsistencies for which the author takes no liability. It is imperative that all investors do their own research or if they need advice, seek it from a qualified financial adviser.
Forensic Analysis: Catapult ASX:CAT