CSL Technical Analysis
View This Company’s Fact Sheet: Open | Last updated: December 13, 2025 at 12:32 AM
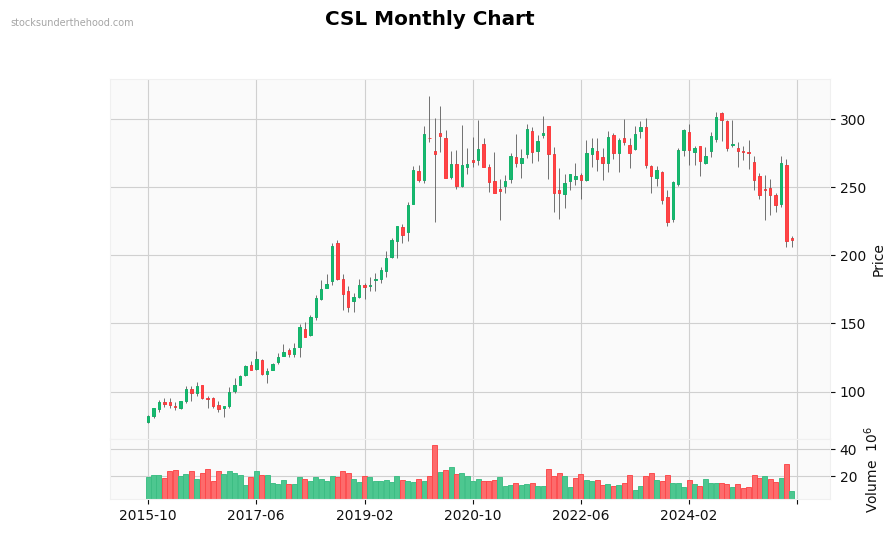
Monthly Observations: Performance: +101.9% (10Y). Volume is above average. Currently in a strong downtrend. Candlestick patterns: Hanging Man (bearish). Long-term downtrend (-33.7% over 2 years). Low volatility, stable movement. Weak 6-month momentum. Price is at recent lows.
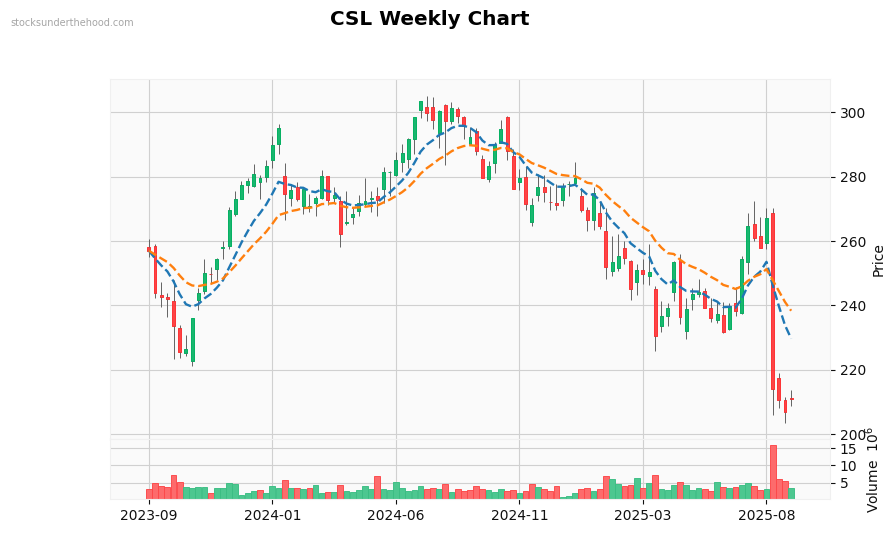
Weekly Observations: Performance: -31.8% (2Y). Volume is significantly above average. with heavy selling pressure. Currently in a strong downtrend. Trading below EMA10. Trading below EMA21. Price is below most EMAs (negative). EMAs are stacked bearishly, but price above EMAs suggests potential support. Price is at recent lows.
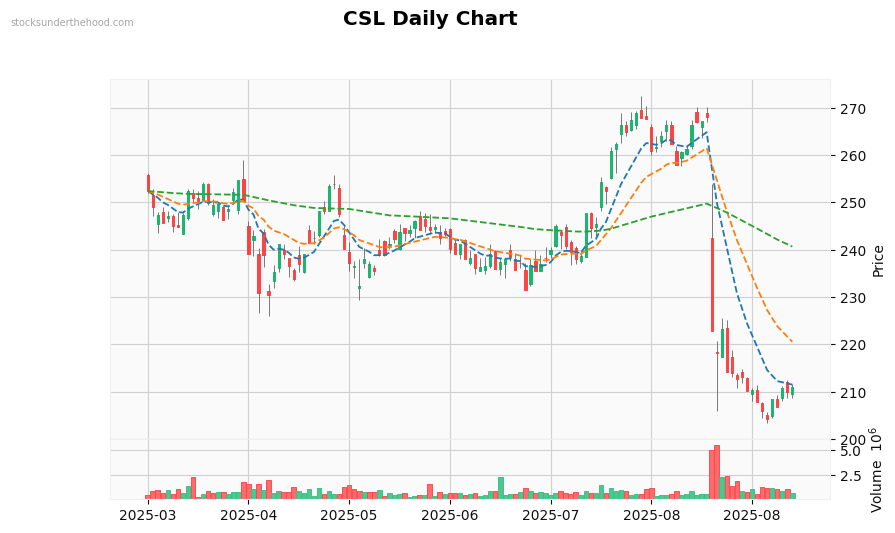
Daily Observations: Performance: -32.6% (1Y). Volume is near average. Currently moving sideways with mixed signals. Trading above EMA10. Trading near EMA21. Trading below EMA125. EMAs are stacked bearishly, but price above EMAs suggests potential support. Price is in the middle of recent range.