BHP Technical Analysis
Last updated: September 10, 2025 at 11:46 PM
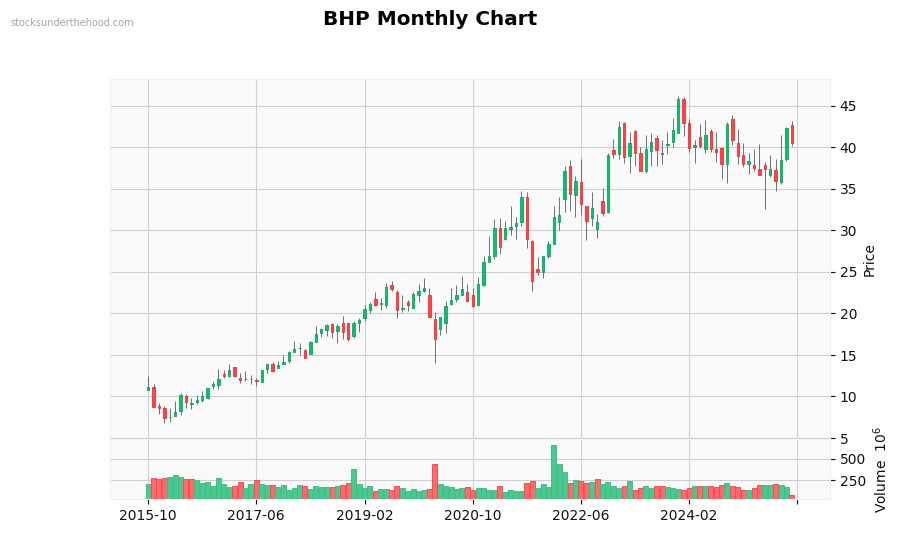
Monthly Observations: Performance: +262.9% (10Y). Volume is near average. Currently moving sideways with mixed signals. Sideways long-term movement (+3.4% over 2 years). Low volatility, stable movement. Down 12.4% from highs. Price is in the middle of recent range.
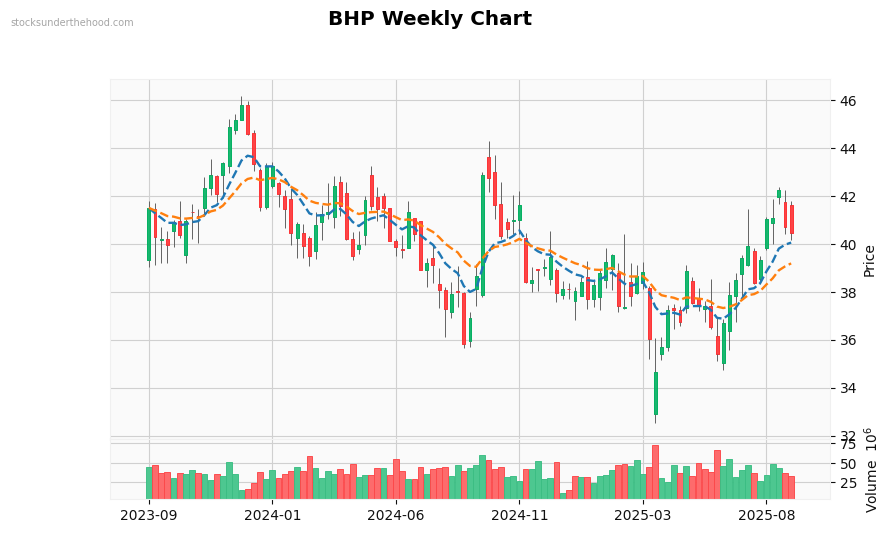
Weekly Observations: Performance: -2.5% (2Y). Volume is near average. Currently moving sideways with mixed signals. Trading above EMA10. Trading above EMA21. Price is above all EMAs (bullish signal). EMAs are stacked bullishly. Price is in the middle of recent range.
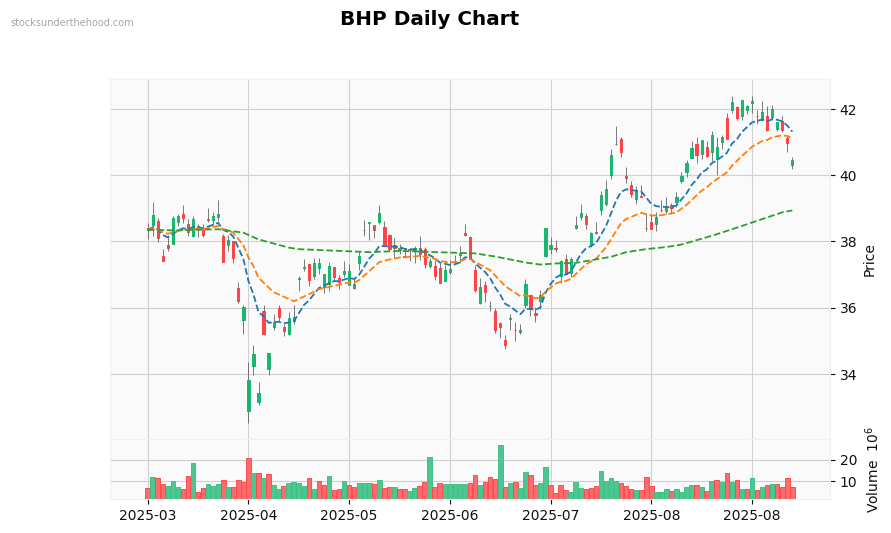
Daily Observations: Performance: +5.5% (6M). Volume is near average. Currently moving sideways with mixed signals. Trading below EMA10. Trading below EMA21. Trading above EMA125. Price is below most EMAs (negative). EMAs are stacked bullishly. Price is in the middle of recent range.