LYC Technical Analysis
View This Company’s Fact Sheet: Open | Last updated: December 05, 2025 at 11:51 PM
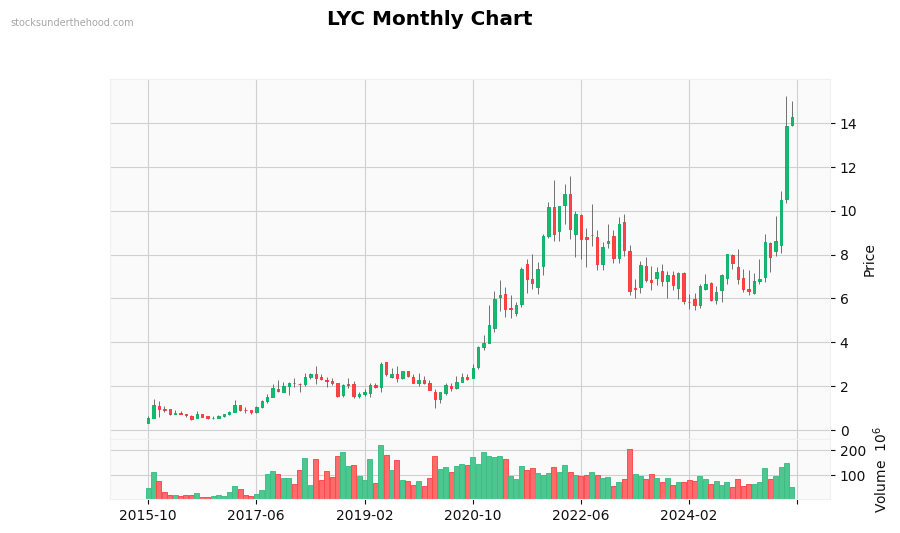
Monthly Observations: Performance: +1409.0% (10Y). Volume is significantly above average. with strong buying interest. Recent volume spike detected. Currently in a strong uptrend. Strong long-term uptrend (+97.5% over 2 years). High volatility stock. Up 2887% from lows. Strong 6-month momentum. Price is in the middle of recent range.
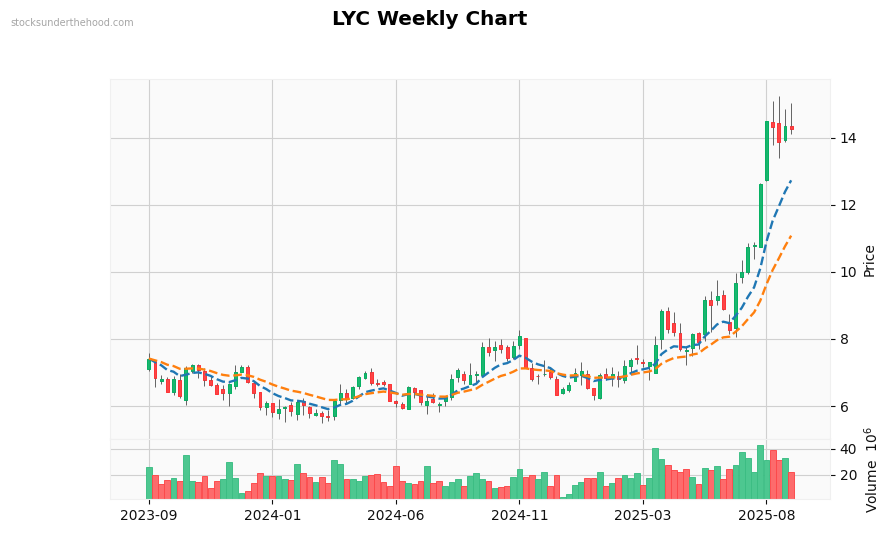
Weekly Observations: Performance: +121.3% (2Y). Volume is significantly above average. with heavy selling pressure. Recent volume spike detected. Currently in a strong downtrend. Trading below EMA10. Trading below EMA21. Price is below most EMAs (negative). EMAs are stacked bullishly. Price is in the middle of recent range.
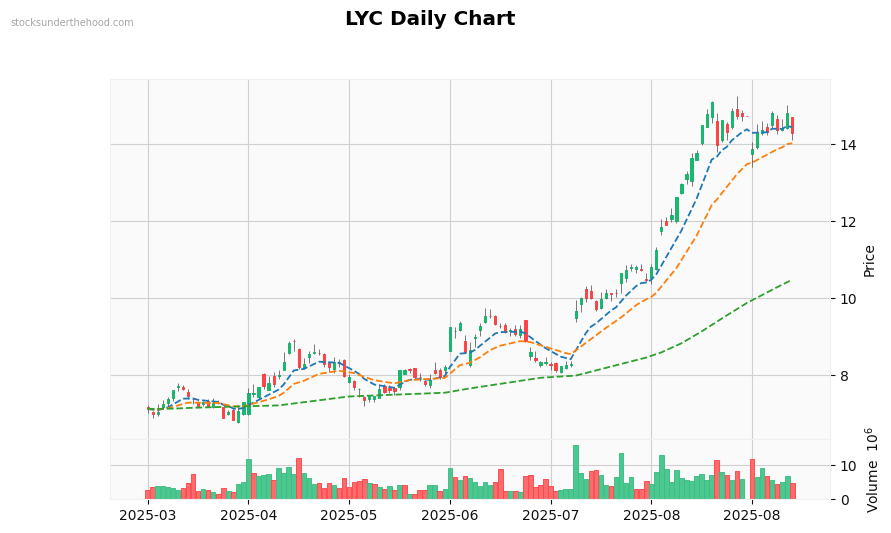
Daily Observations: Performance: +97.8% (1Y). Volume is significantly above average. with heavy selling pressure. Currently in a strong downtrend. Trading below EMA10. Trading below EMA21. Trading above EMA125. Price is below most EMAs (negative). EMAs show mixed signals. Price is near recent lows.