COL Technical Analysis
View This Company’s Fact Sheet: Open | Last updated: December 05, 2025 at 11:42 PM
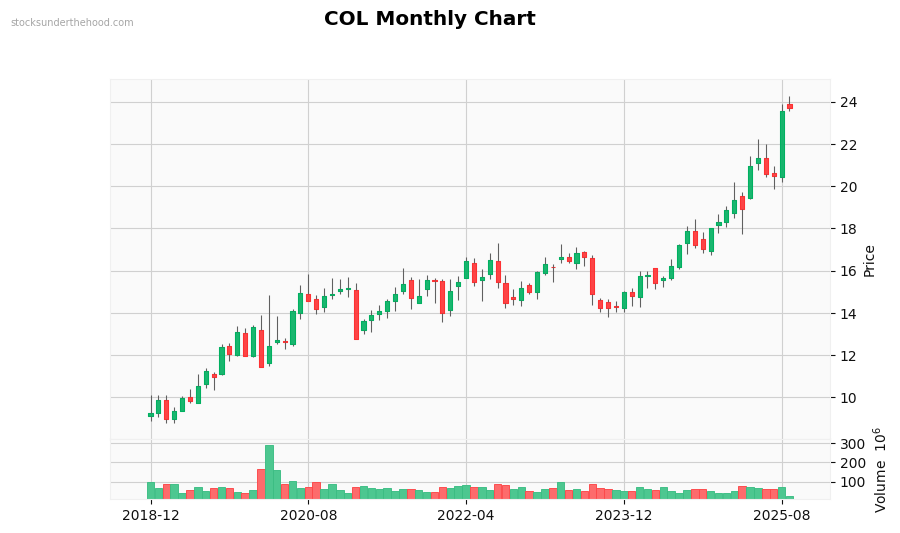
Monthly Observations: Performance: +137.3% (10Y). Volume is near average. Currently in a strong uptrend. Solid long-term gains (+45.6% over 2 years). Low volatility, stable movement. Down 8.8% from highs. Price is near recent highs.
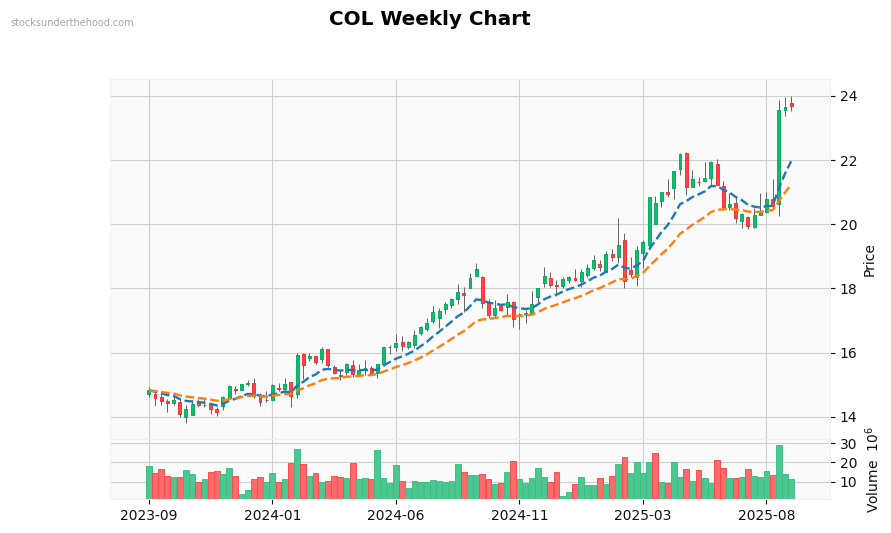
Weekly Observations: Performance: +49.7% (2Y). Volume is near average. Currently in a strong downtrend. Trading below EMA10. Trading below EMA21. Price is below most EMAs (negative). EMAs are stacked bullishly. Price is in the middle of recent range.
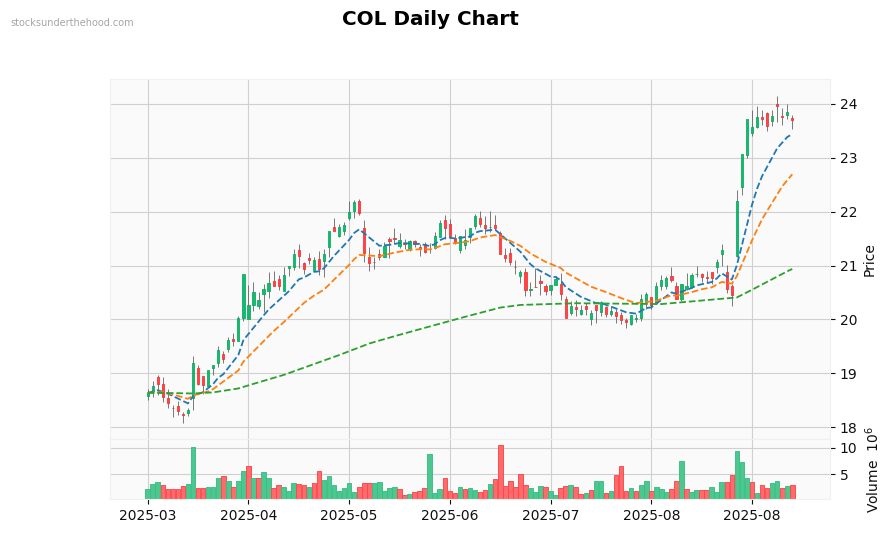
Daily Observations: Performance: +17.4% (1Y). Volume is near average. Currently in a downtrend. Trading below EMA10. Trading below EMA21. Trading below EMA125. Price is below most EMAs (negative). EMAs show mixed signals. Price is at recent lows.