TAH Technical Analysis
View This Company’s Fact Sheet: Open | Last updated: December 13, 2025 at 12:53 AM
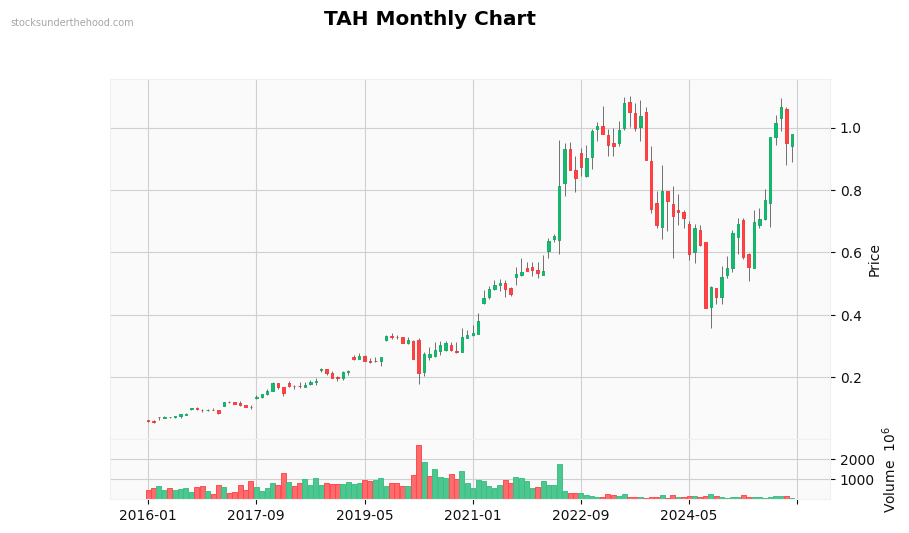
Monthly Observations: Performance: +1515.0% (10Y). Volume is below average. Currently in a strong uptrend. Solid long-term gains (+22.9% over 2 years). Moderate volatility. Down 11.1% from highs. Up 1725% from lows. Strong 6-month momentum. Price is near recent highs.
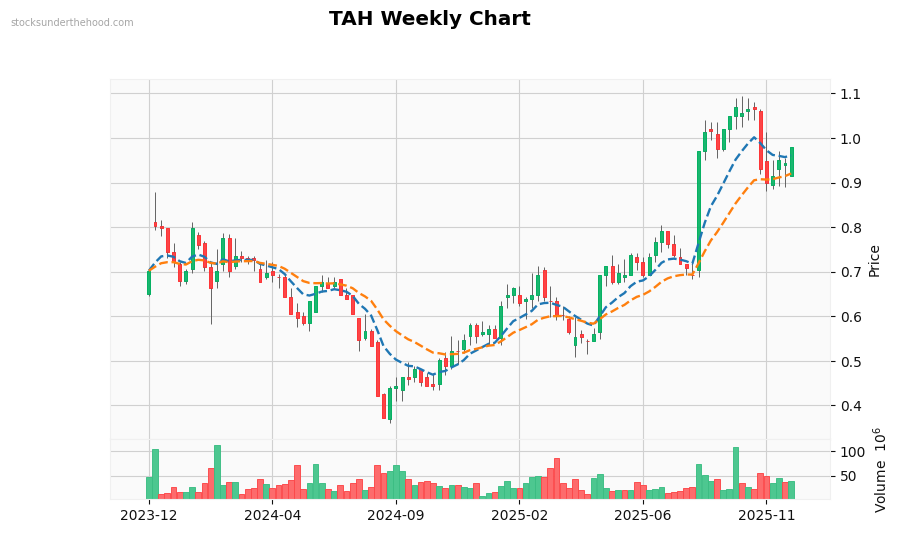
Weekly Observations: Performance: +39.6% (2Y). Volume is above average. with heavy selling pressure. Currently in a strong downtrend. Trading above EMA10. Trading above EMA21. Price is above all EMAs (bullish signal). EMAs are stacked bullishly. Price is near recent highs.
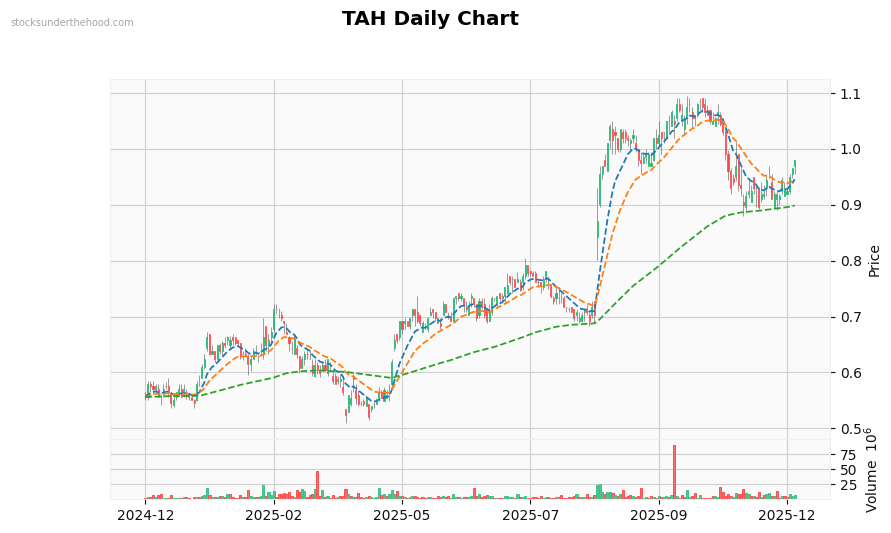
Daily Observations: Performance: +76.3% (1Y). Volume is near average. Currently in a strong uptrend. Trading above EMA10. Trading above EMA21. Trading above EMA125. Price is above all EMAs (bullish signal). EMAs are stacked bullishly. Price is in the middle of recent range.