PNV Technical Analysis
View This Company’s Fact Sheet: Open | Last updated: December 05, 2025 at 11:59 PM
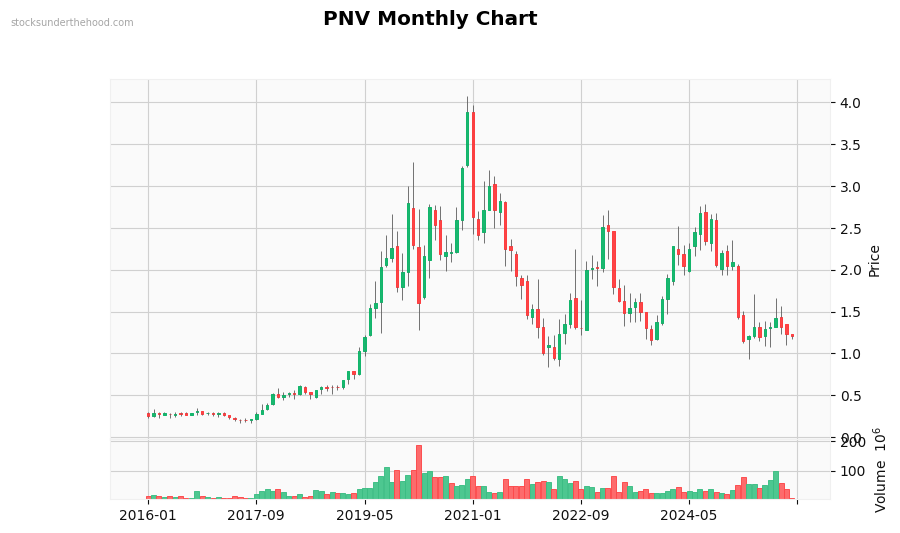
Monthly Observations: Performance: +372.5% (10Y). Volume is significantly above average. with strong buying interest. Recent volume spike detected. Currently in a strong downtrend. Long-term downtrend (-27.2% over 2 years). High volatility stock. Up 609% from lows. Price is near recent lows.
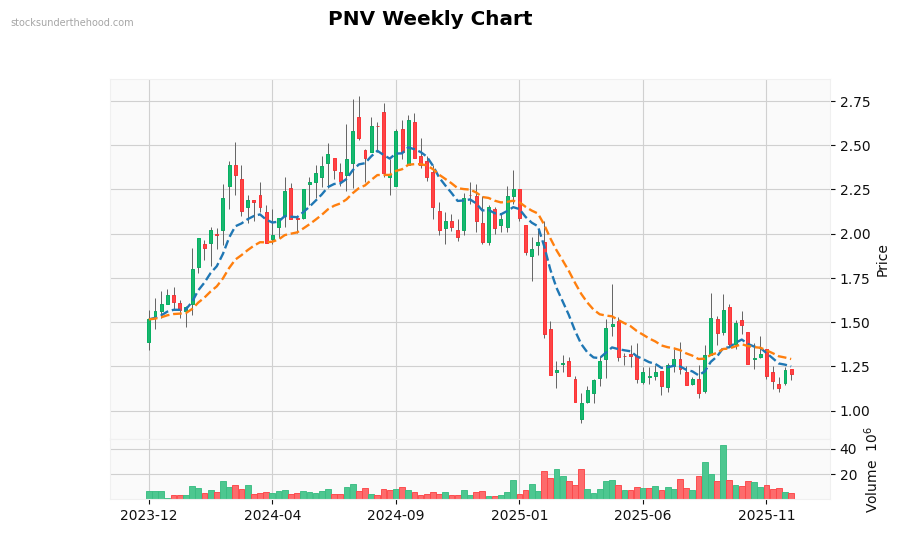
Weekly Observations: Performance: -20.5% (2Y). Volume is near average. Currently in a downtrend. Trading below EMA10. Trading below EMA21. Price is below most EMAs (negative). EMAs are stacked bearishly, but price above EMAs suggests potential support. Price is near recent lows.
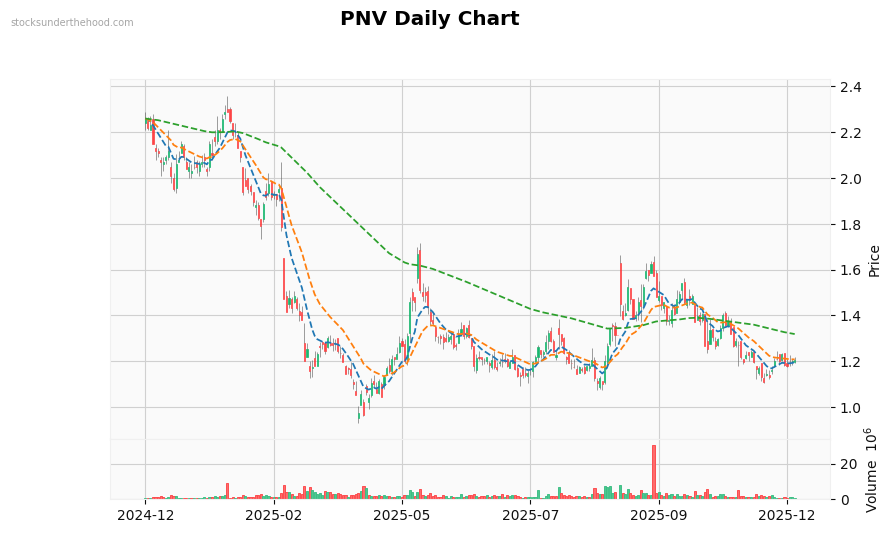
Daily Observations: Performance: -46.7% (1Y). Volume is below average. Currently moving sideways with mixed signals. Trading above EMA10. Trading near EMA21. Trading below EMA125. EMAs are stacked bearishly, but price above EMAs suggests potential support. Price is near recent lows.