MedAdvisor Limited offers a digital medication management platform that connects patients with pharmacies and healthcare providers to improve medication adherence.
Ticker code: MDR
Sector: Healthcare | Industry: Health Information Services | Website: https://www.medadvisorsolutions.com
Market Information
| Market Capitalisation | Enterprise Value | Shares Outstanding | Free Float [%] | Free Float Value |
|---|---|---|---|---|
| $14,003,474 | $21,095,549 | 636521550 | 61.82 | $8,657,234 |
Balance Sheet & Quality
| Equity | Cash | Debt | Return On Equity (ROE) | EBITDA 25 Margin [%] | Net Debt / Equity [%] | Rule of 40 |
|---|---|---|---|---|---|---|
| $1,273,043 | $10,303,813 | $17,395,888 | 0.0 | 5.7 | 557.1 | 6.2 |
Technicals & Short Data
| 3EMA Status | Volatility [%] | Value Traded Today | Average Daily Liquidity | Short [%] | Days To Cover |
|---|---|---|---|---|---|
| Negative | 42.9 | $1,305 | $30,562 | 0.0 | 0.0 |
Dividends
| Previous Dividend | Last Dividend | Franking [%] | Ex-Div Date | Gross Yield [%] |
|---|---|---|---|---|
| None | None | None | None | 0.0 |
Price Performance Snapshot
| Last Traded Price | Change [%] | 1 Week [%] | 1 Month [%] | 3 Months [%] | 6 Months [%] | 12 Months [%] |
|---|---|---|---|---|---|---|
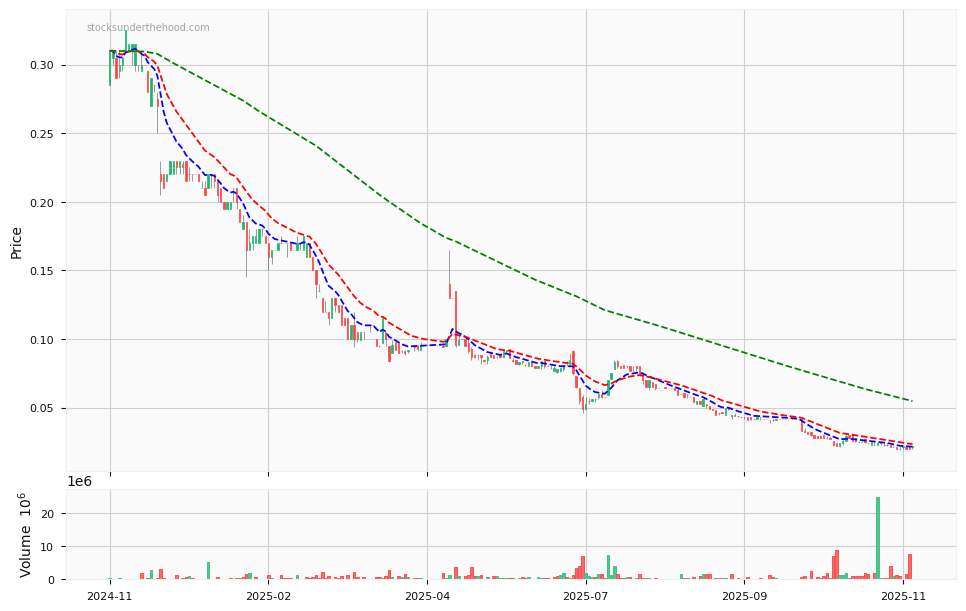
| $0.022 | 10.0 | 10.0 | -21.4 | -55.1 | -74.4 | -93.2 |
MDR Price Chart with Volume and 3EMA
MDR Short Positions

Click HERE to understand why the above moving averages have been chosen.