The iShares China Large-Cap ETF (ASX:IZZ) tracks the FTSE China 50 Index (before fees). It provides exposure to the 50 largest and most liquid Chinese companies listed on the Hong Kong Stock Exchange, including Tencent, Alibaba and China Construction Bank.
Ticker code: IZZ
Sector: International | Industry: ETF | Website: https://www.blackrock.com/au/products/273424/ishares-china-large-cap-etf
Market Information
| Market Capitalisation | Enterprise Value | Shares Outstanding | Free Float [%] | Free Float Value |
|---|---|---|---|---|
| $7,457,865,216 | None | 94950000.0 | 0.0 | $0 |
Balance Sheet & Quality
| Equity | Cash | Debt | Return On Equity (ROE) | EBITDA 25 Margin [%] | Net Debt / Equity [%] | Rule of 40 |
|---|---|---|---|---|---|---|
| $3,808,634,337 | None | None | None | None | 0.0 | None |
Technicals & Short Data
| 3EMA Status | Volatility [%] | Value Traded Today | Average Daily Liquidity | Short [%] | Days To Cover |
|---|---|---|---|---|---|
| Partial | None | $1,421,935 | $1,914,080 | None | 0.0 |
Dividends
| Previous Dividend | Last Dividend | Franking [%] | Ex-Div Date | Gross Yield [%] |
|---|---|---|---|---|
| $1.456 | $0.634 | None | 2025-07-01 | None |
Price Performance Snapshot
| Last Traded Price | Change [%] | 1 Week [%] | 1 Month [%] | 3 Months [%] | 6 Months [%] | 12 Months [%] |
|---|---|---|---|---|---|---|
| $59.560 | -0.6 | 0.5 | -1.6 | 0.5 | 9.9 | 31.7 |
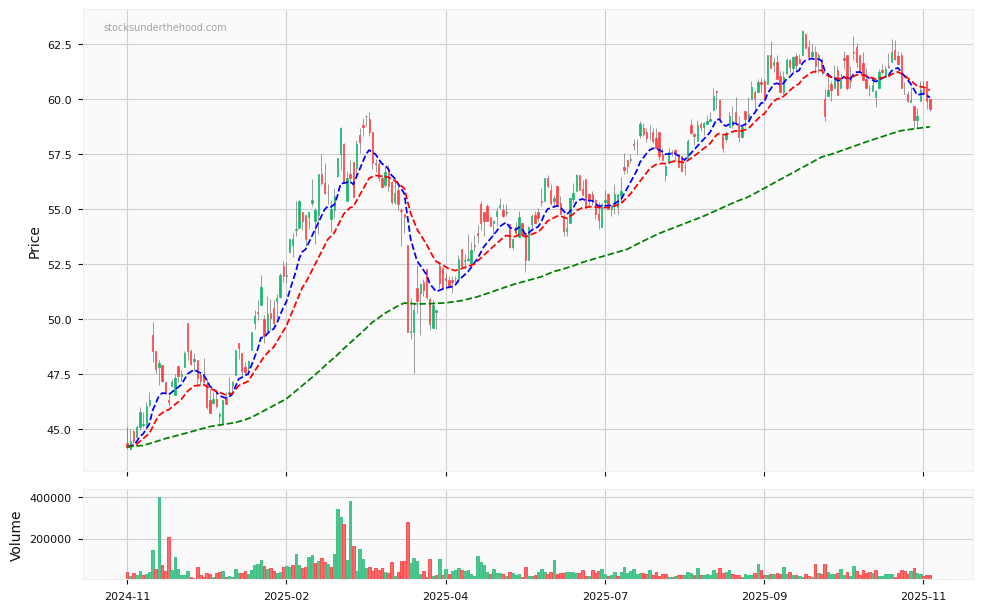
IZZ Price Chart with Volume and 3EMA
IZZ Short Positions

Click HERE to understand why the above moving averages have been chosen.