The Invesco QQQ Trust (NASDAQ:QQQ) tracks the Nasdaq-100 Index (before fees). It provides exposure to 100 of the largest non-financial companies listed on Nasdaq, heavily weighted toward innovative technology and growth stocks like Apple, Microsoft, Nvidia, Amazon and Meta.
Ticker code: QQQ
Sector: Index | Industry: ETF | Website: https://www.invesco.com/qqq-etf/en/home.html
Market Information
| Market Capitalisation | Enterprise Value | Shares Outstanding | Free Float [%] | Free Float Value |
|---|---|---|---|---|
| $243,427,180,544 | None | 393100000.0 | 0.0 | $0 |
Balance Sheet & Quality
| Equity | Cash | Debt | Return On Equity (ROE) | EBITDA 25 Margin [%] | Net Debt / Equity [%] | Rule of 40 |
|---|---|---|---|---|---|---|
| $140,640,955,933 | None | None | None | None | 0.0 | None |
Technicals & Short Data
| 3EMA Status | Volatility [%] | Value Traded Today | Average Daily Liquidity | Short [%] | Days To Cover |
|---|---|---|---|---|---|
| Positive | None | $13,071,603,965 | $36,227,034,059 | None | 0.0 |
Dividends
| Previous Dividend | Last Dividend | Franking [%] | Ex-Div Date | Gross Yield [%] |
|---|---|---|---|---|
| $0.591 | $0.694 | None | 2025-09-22 | None |
Price Performance Snapshot
| Last Traded Price | Change [%] | 1 Week [%] | 1 Month [%] | 3 Months [%] | 6 Months [%] | 12 Months [%] |
|---|---|---|---|---|---|---|
| $619.250 | 0.8 | 2.3 | -1.6 | 9.6 | 17.7 | 19.3 |
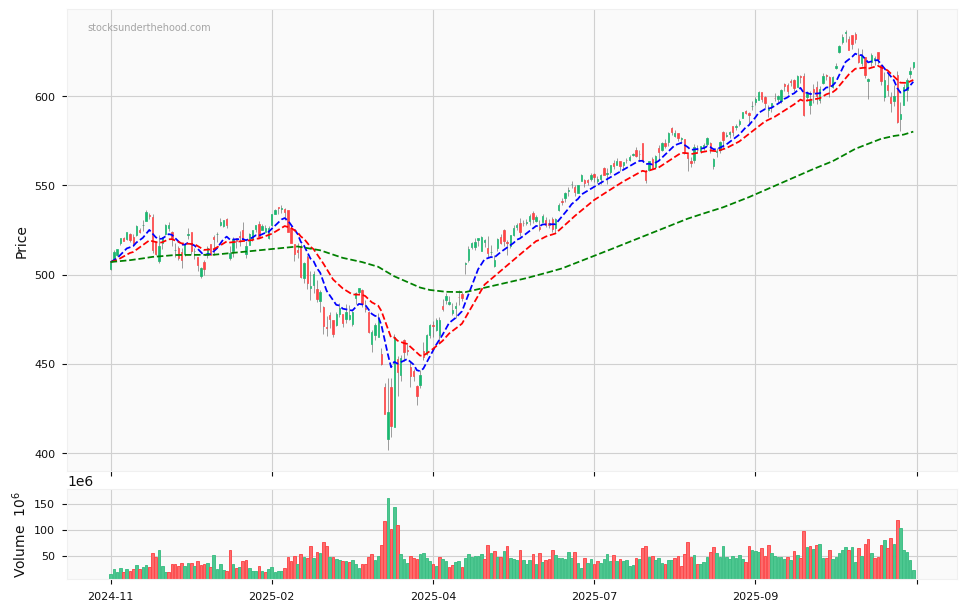
QQQ Price Chart with Volume and 3EMA
QQQ Short Positions
No chart available for this company.
Click HERE to understand why the above moving averages have been chosen.