ALS Limited is a leading testing, inspection, certification, and verification company, providing services to various industries, including mining, environmental, food, pharmaceutical, and industrial sectors. Headquartered in Brisbane, Australia, ALS operates a network of laboratories and offices globally, offering analytical testing and technical services.
Ticker code: ALQ
Sector: Industrials | Industry: Consulting Services | Website: https://www.alsglobal.com
Market Information
| Market Capitalisation | Enterprise Value | Shares Outstanding | Free Float [%] | Free Float Value |
|---|---|---|---|---|
| $10,935,223,924 | $12,481,023,860 | 507199638 | 95.18 | $10,408,260,691 |
Balance Sheet & Quality
| Equity | Cash | Debt | Return On Equity (ROE) | EBITDA 25 Margin [%] | Net Debt / Equity [%] | Rule of 40 |
|---|---|---|---|---|---|---|
| $1,707,233,981 | $211,200,000 | $1,756,999,936 | 18.2 | 24.3 | 90.5 | 41.6 |
Technicals & Short Data
| 3EMA Status | Volatility [%] | Value Traded Today | Average Daily Liquidity | Short [%] | Days To Cover |
|---|---|---|---|---|---|
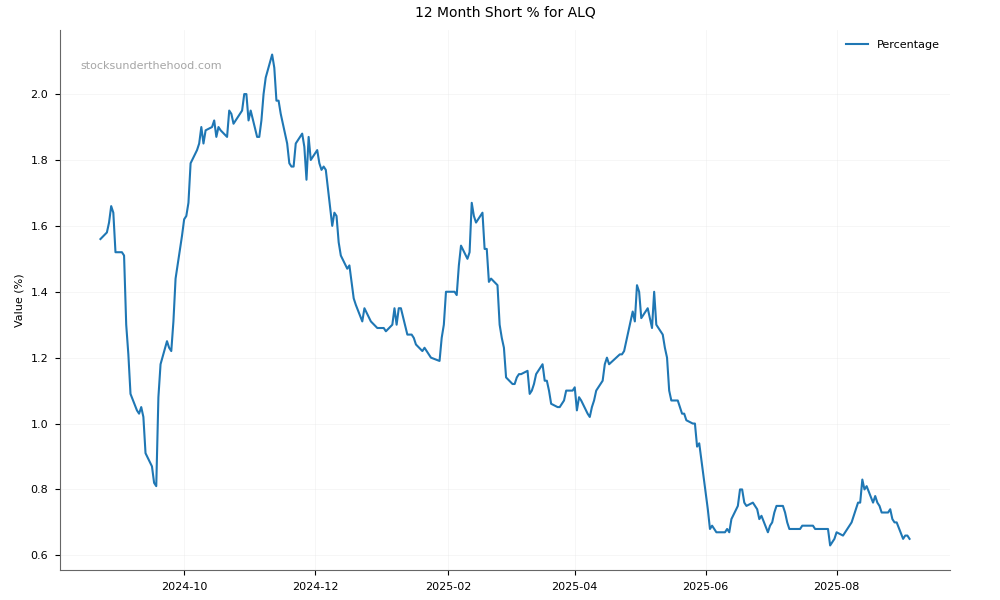
| Positive | 4.5 | $17,613,420 | $31,426,718 | 1.18 | 4.1 |
Dividends
| Previous Dividend | Last Dividend | Franking [%] | Ex-Div Date | Gross Yield [%] |
|---|---|---|---|---|
| $0.197 | $0.194 | 30.0 | 2025-11-26 | 2.0 |
Price Performance Snapshot
| Last Traded Price | Change [%] | 1 Week [%] | 1 Month [%] | 3 Months [%] | 6 Months [%] | 12 Months [%] |
|---|---|---|---|---|---|---|
| $21.560 | -2.0 | -2.0 | -0.8 | 15.7 | 33.8 | 39.8 |
ALQ Price Chart with Volume and 3EMA

ALQ Short Positions
Click HERE to understand why the above moving averages have been chosen.