Amazon is a global e-commerce and cloud computing giant, offering online retail, Amazon Web Services (AWS), digital streaming, and AI-driven smart devices like Alexa. It dominates online shopping and has a strong presence in logistics, entertainment, and AI.
Ticker code: AMZN
Sector: Consumer Cyclical | Industry: Internet Retail | Website: https://www.amazon.com
Market Information
| Market Capitalisation | Enterprise Value | Shares Outstanding | Free Float [%] | Free Float Value |
|---|---|---|---|---|
| $2,461,742,929,964 | $2,527,983,925,292 | 10690216011 | 90.76 | $2,234,179,413,531 |
Balance Sheet & Quality
| Equity | Cash | Debt | Return On Equity (ROE) | EBITDA 25 Margin [%] | Net Debt / Equity [%] | Rule of 40 |
|---|---|---|---|---|---|---|
| $369,742,526,285 | $94,196,998,144 | $160,437,993,472 | 19.2 | 23.9 | 17.9 | 28.6 |
Technicals & Short Data
| 3EMA Status | Volatility [%] | Value Traded Today | Average Daily Liquidity | Short [%] | Days To Cover |
|---|---|---|---|---|---|
| Partial | 5.3 | $6,404,565,288 | $11,086,396,233 | None | 0.0 |
Dividends
| Previous Dividend | Last Dividend | Franking [%] | Ex-Div Date | Gross Yield [%] |
|---|---|---|---|---|
| None | None | None | None | 0.0 |
Price Performance Snapshot
| Last Traded Price | Change [%] | 1 Week [%] | 1 Month [%] | 3 Months [%] | 6 Months [%] | 12 Months [%] |
|---|---|---|---|---|---|---|
| $230.280 | -0.6 | 0.3 | -5.7 | 3.0 | 34.7 | None |
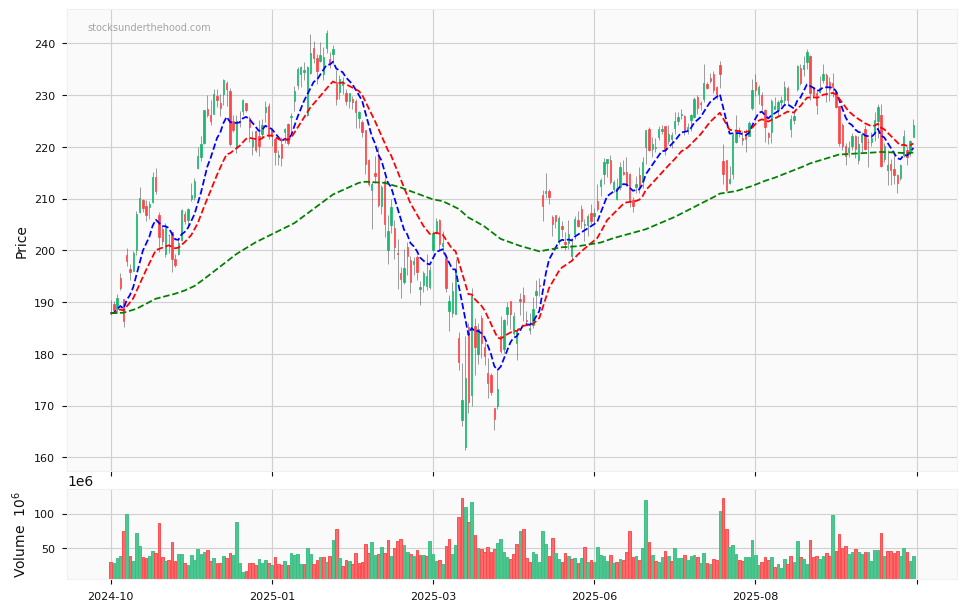
AMZN Price Chart with Volume and 3EMA
AMZN Short Positions
No chart available for this company.
Click HERE to understand why the above moving averages have been chosen.