APA Group owns and operates energy infrastructure, including gas pipelines, storage facilities, and renewable energy assets. It ensures the safe and reliable delivery of natural gas and energy to Australians.
Ticker code: APA
Sector: Utilities | Industry: Utilities – Regulated Gas | Website: https://www.apa.com.au
Market Information
| Market Capitalisation | Enterprise Value | Shares Outstanding | Free Float [%] | Free Float Value |
|---|---|---|---|---|
| $11,994,450,715 | $25,326,450,459 | 1315181016 | 99.14 | $11,891,572,310 |
Balance Sheet & Quality
| Equity | Cash | Debt | Return On Equity (ROE) | EBITDA 25 Margin [%] | Net Debt / Equity [%] | Rule of 40 |
|---|---|---|---|---|---|---|
| $2,689,545,145 | $800,000,000 | $14,131,999,744 | 6.4 | 62.0 | 495.7 | 65.1 |
Technicals & Short Data
| 3EMA Status | Volatility [%] | Value Traded Today | Average Daily Liquidity | Short [%] | Days To Cover |
|---|---|---|---|---|---|
| Positive | 1.4 | $21,998,434 | $25,198,204 | 2.24 | 10.7 |
Dividends
| Previous Dividend | Last Dividend | Franking [%] | Ex-Div Date | Gross Yield [%] |
|---|---|---|---|---|
| $0.270 | $0.300 | 30.0 | 2025-06-27 | 3.6 |
Price Performance Snapshot
| Last Traded Price | Change [%] | 1 Week [%] | 1 Month [%] | 3 Months [%] | 6 Months [%] | 12 Months [%] |
|---|---|---|---|---|---|---|
| $9.120 | 0.2 | 0.3 | 3.3 | 9.2 | 14.0 | 39.1 |
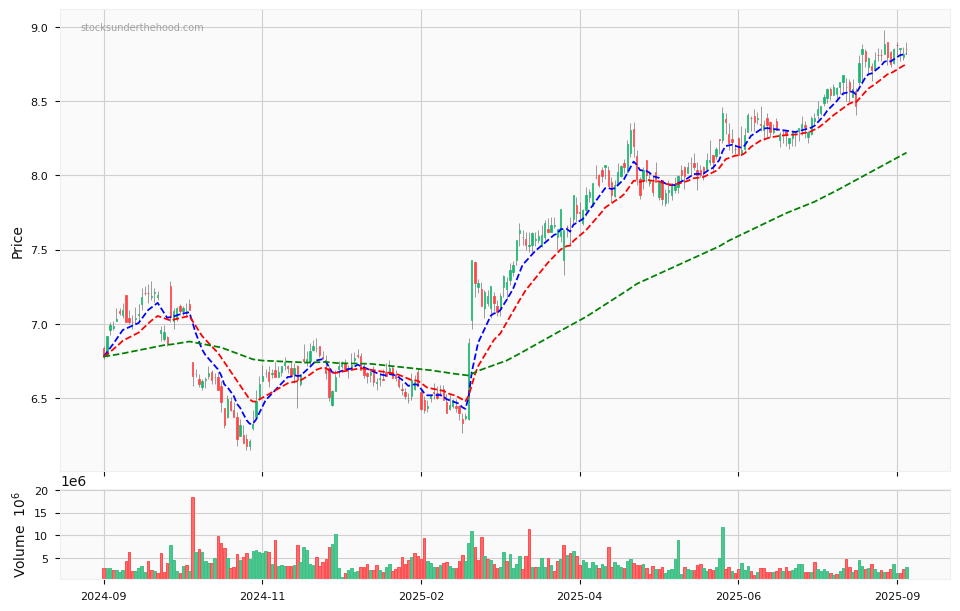
APA Price Chart with Volume and 3EMA
APA Short Positions

Click HERE to understand why the above moving averages have been chosen.