ASX Limited operates the Australian Securities Exchange, providing a marketplace for trading a diverse range of financial products, including equities, derivatives, and fixed-income securities.
Ticker code: ASX:ASX
Sector: Financial Services | Industry: Financial Data & Stock Exchanges | Website: https://www.asx.com.au
Market Information
| Market Capitalisation | Enterprise Value | Shares Outstanding | Free Float [%] | Free Float Value |
|---|---|---|---|---|
| $11,806,570,882 | $9,965,670,400 | 194299008 | 99.75 | $11,777,314,742 |
Balance Sheet & Quality
| Equity | Cash | Debt | Return On Equity (ROE) | EBITDA 24 Margin [%] | Net Debt / Equity [%] | Rule of 40 |
|---|---|---|---|---|---|---|
| $3,872,962,160 | $2,237,700,096 | $310,900,000 | 13.0 | 62.1 | -49.8 | 67.7 |
Technicals & Short Data
| 3EMA Status | Volatility [%] | Value Traded Today | Average Daily Liquidity | Short [%] | Days To Cover |
|---|---|---|---|---|---|
| Negative | 1.5 | $31,959,395 | $29,815,214 | 1.37 | 5.4 |
Dividends
| Previous Dividend | Last Dividend | Franking [%] | Ex-Div Date | Gross Yield [%] |
|---|---|---|---|---|
| $1.112 | $1.121 | 100.0 | 2025-08-22 | 5.2 |
Price Performance Snapshot
| Last Traded Price | Change [%] | 1 Week [%] | 1 Month [%] | 3 Months [%] | 6 Months [%] | 12 Months [%] |
|---|---|---|---|---|---|---|
| $60.890 | -0.5 | -0.6 | -4.1 | -13.9 | -3.8 | -0.9 |
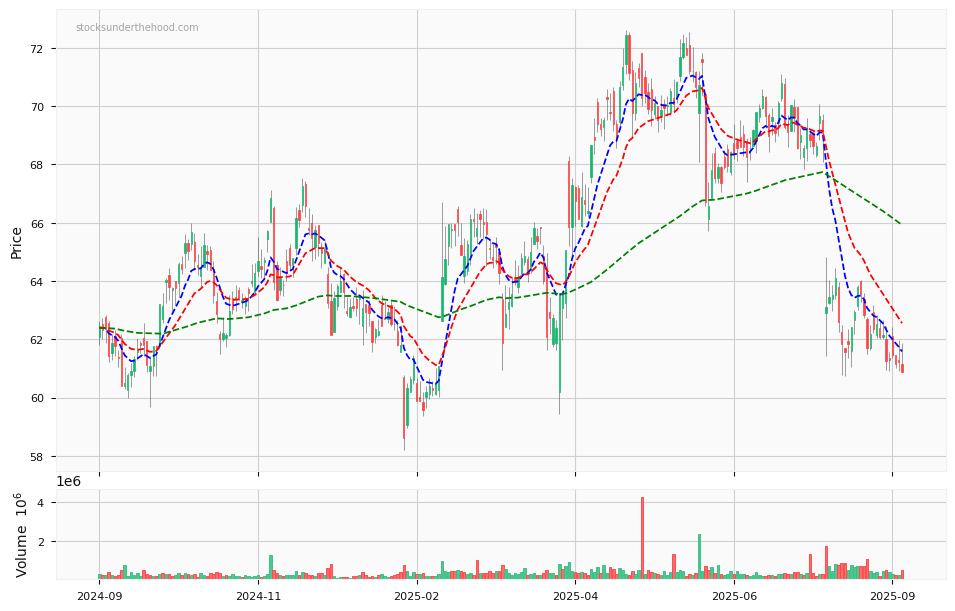
ASX:ASX Price Chart with Volume and 3EMA
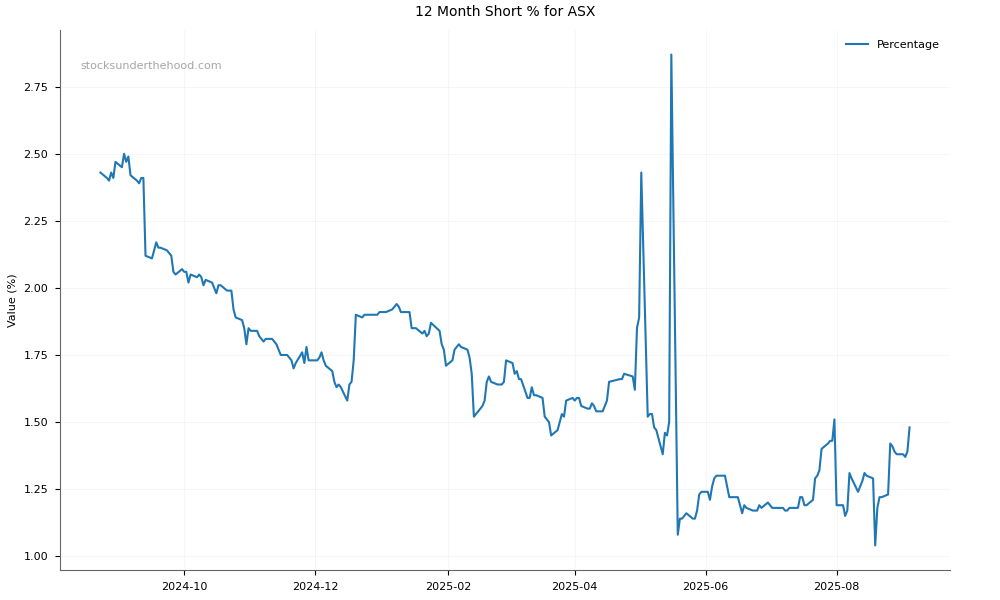
ASX:ASX Short Positions
Click HERE to understand why the above moving averages have been chosen.