AVJennings Limited is a residential property development company in Australia, focusing on land development, integrated housing, and apartment construction.
Ticker code: ASX:AVJ
Sector: Real Estate | Industry: Real Estate – Development | Website: https://www.avjennings.com.au
Market Information
| Market Capitalisation | Enterprise Value | Shares Outstanding | Free Float [%] | Free Float Value |
|---|---|---|---|---|
| $372,909,280 | $581,818,304 | 565014016 | 24.94 | $93,011,874 |
Balance Sheet & Quality
| Equity | Cash | Debt | Return On Equity (ROE) | EBITDA 24 Margin [%] | Net Debt / Equity [%] | Rule of 40 |
|---|---|---|---|---|---|---|
| $463,876,494 | $9,933,000 | $223,679,008 | None | None | 46.1 | None |
Technicals & Short Data
| 3EMA Status | Volatility [%] | Value Traded Today | Average Daily Liquidity | Short [%] | Days To Cover |
|---|---|---|---|---|---|
| None | 2.3 | $1,988,109 | $515,207 | None | 0.0 |
Dividends
| Previous Dividend | Last Dividend | Franking [%] | Ex-Div Date | Gross Yield [%] |
|---|---|---|---|---|
| None | None | None | 2023-03-08 | None |
Price Performance Snapshot
| Last Traded Price | Change [%] | 1 Week [%] | 1 Month [%] | 3 Months [%] | 6 Months [%] | 12 Months [%] |
|---|---|---|---|---|---|---|
| $0.660 | None | None | -0.8 | 1.5 | -8.3 | 112.9 |
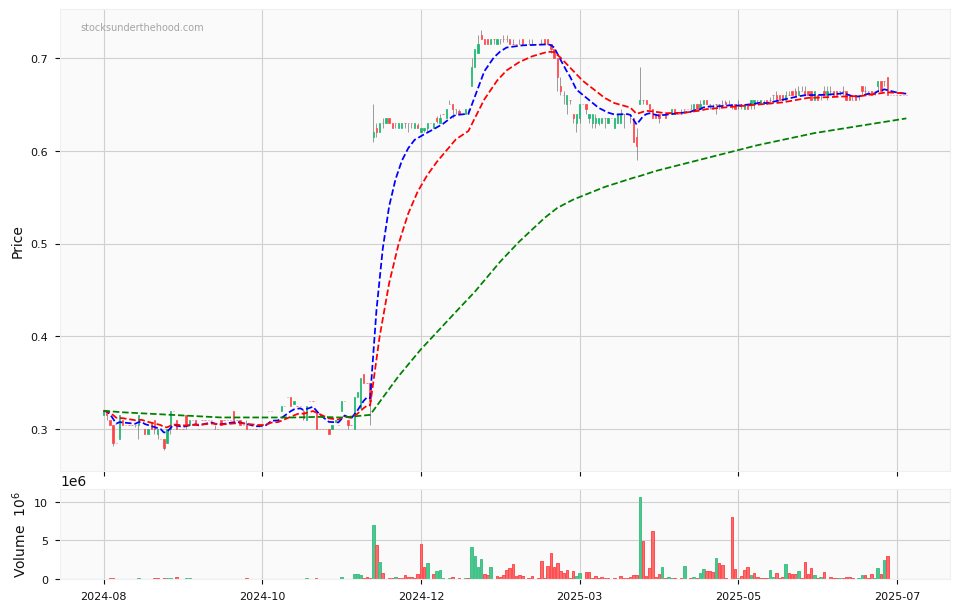
ASX:AVJ Price Chart with Volume and 3EMA
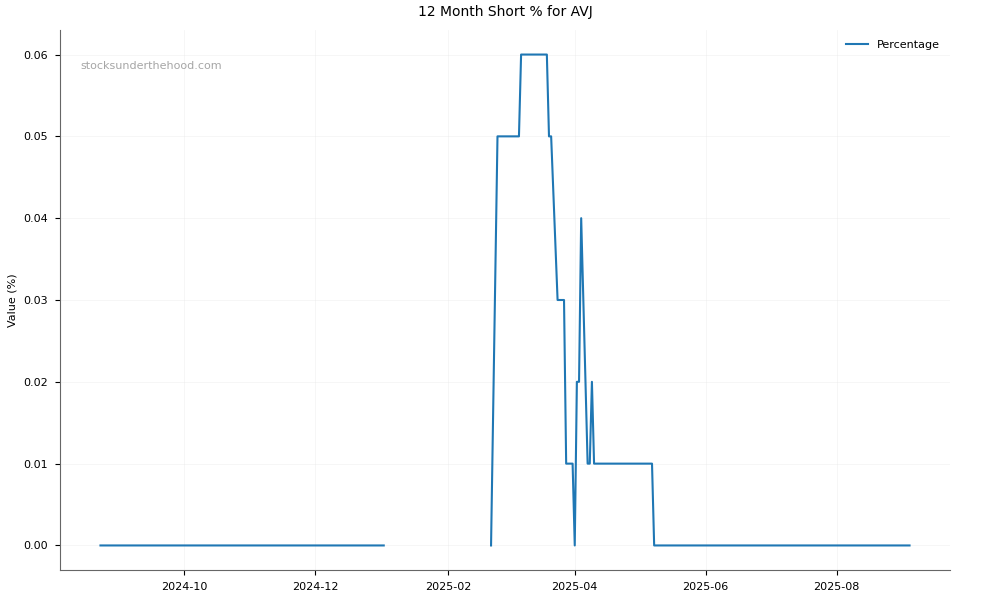
ASX:AVJ Short Positions
Click HERE to understand why the above moving averages have been chosen.