Bellevue Gold Limited is a gold exploration and development company focused on advancing its high-grade Bellevue Gold Project in Western Australia.
Ticker code: BGL
Sector: Basic Materials | Industry: Gold | Website: https://bellevuegold.com.au
Market Information
| Market Capitalisation | Enterprise Value | Shares Outstanding | Free Float [%] | Free Float Value |
|---|---|---|---|---|
| $2,013,818,543 | $2,204,517,551 | 1480748913 | 91.32 | $1,839,115,525 |
Balance Sheet & Quality
| Equity | Cash | Debt | Return On Equity (ROE) | EBITDA 25 Margin [%] | Net Debt / Equity [%] | Rule of 40 |
|---|---|---|---|---|---|---|
| $823,296,359 | $151,592,000 | $342,291,008 | -5.4 | 44.9 | 23.2 | 72.4 |
Technicals & Short Data
| 3EMA Status | Volatility [%] | Value Traded Today | Average Daily Liquidity | Short [%] | Days To Cover |
|---|---|---|---|---|---|
| Positive | 9.6 | $12,723,306 | $19,925,017 | 1.68 | 1.7 |
Dividends
| Previous Dividend | Last Dividend | Franking [%] | Ex-Div Date | Gross Yield [%] |
|---|---|---|---|---|
| None | None | None | None | 0.0 |
Price Performance Snapshot
| Last Traded Price | Change [%] | 1 Week [%] | 1 Month [%] | 3 Months [%] | 6 Months [%] | 12 Months [%] |
|---|---|---|---|---|---|---|
| $1.360 | -2.5 | 1.5 | 11.9 | 48.6 | 49.5 | -1.4 |
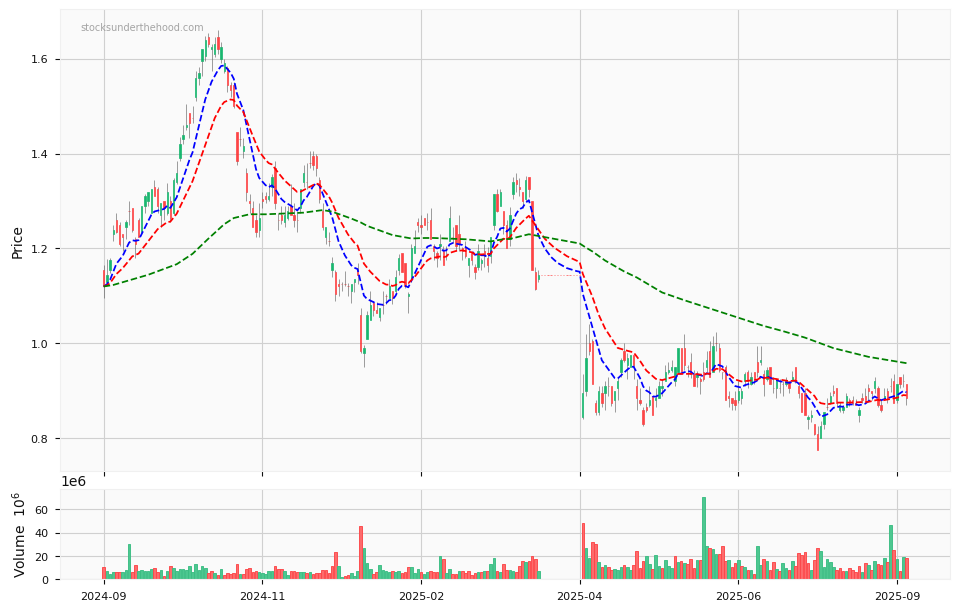
BGL Price Chart with Volume and 3EMA
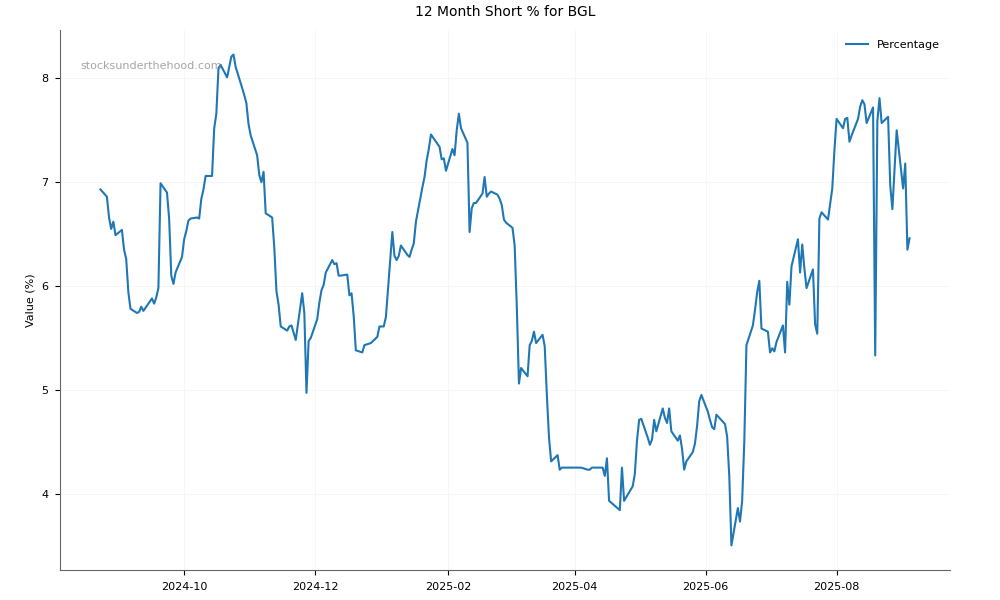
BGL Short Positions
Click HERE to understand why the above moving averages have been chosen.