BHP Group Limited is a leading global resources company, producing commodities like iron ore, copper, and coal, with operations spanning several continents.
Ticker code: ASX:BHP
Sector: Basic Materials | Industry: Other Industrial Metals & Mining | Website: https://www.bhp.com
Market Information
| Market Capitalisation | Enterprise Value | Shares Outstanding | Free Float [%] | Free Float Value |
|---|---|---|---|---|
| $205,283,763,269 | $226,095,661,056 | 5078210048 | 94.98 | $194,969,013,009 |
Balance Sheet & Quality
| Equity | Cash | Debt | Return On Equity (ROE) | EBITDA 24 Margin [%] | Net Debt / Equity [%] | Rule of 40 |
|---|---|---|---|---|---|---|
| $47,694,550,298 | $11,943,999,488 | $25,551,998,976 | 30.6 | 52.1 | 28.5 | 43.9 |
Technicals & Short Data
| 3EMA Status | Volatility [%] | Value Traded Today | Average Daily Liquidity | Short [%] | Days To Cover |
|---|---|---|---|---|---|
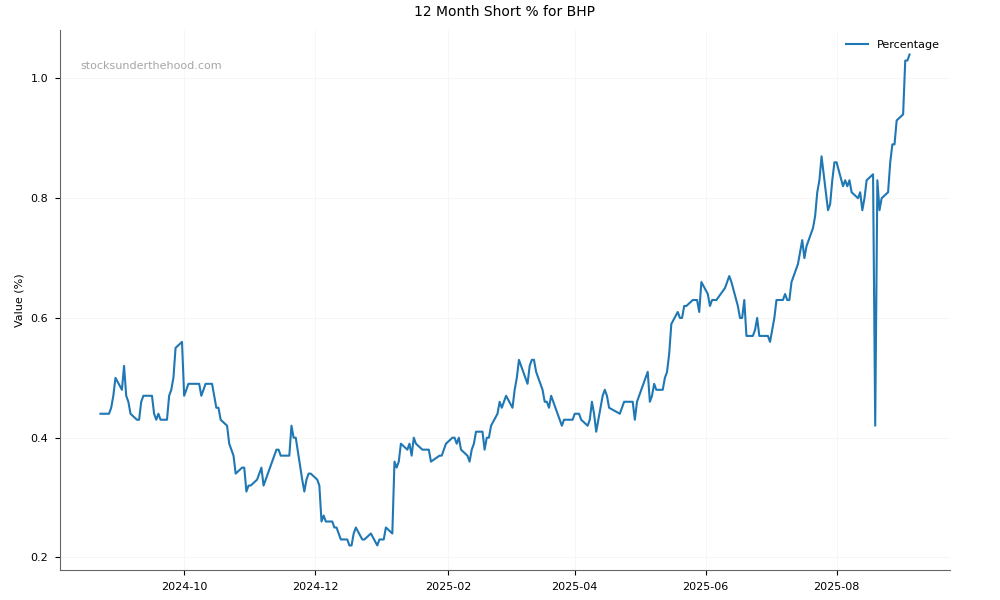
| Positive | 1.5 | $291,914,524 | $352,136,036 | 1.03 | 6.0 |
Dividends
| Previous Dividend | Last Dividend | Franking [%] | Ex-Div Date | Gross Yield [%] |
|---|---|---|---|---|
| $0.791 | $0.919 | 100.0 | 2025-09-04 | 6.0 |
Price Performance Snapshot
| Last Traded Price | Change [%] | 1 Week [%] | 1 Month [%] | 3 Months [%] | 6 Months [%] | 12 Months [%] |
|---|---|---|---|---|---|---|
| $40.460 | -1.2 | -2.2 | 1.2 | 7.9 | 7.0 | 6.6 |
ASX:BHP Price Chart with Volume and 3EMA

ASX:BHP Short Positions
Click HERE to understand why the above moving averages have been chosen.