Boeing is a leading aerospace and defense company that designs, manufactures, and services commercial airplanes, military aircraft, satellites, and space exploration systems. It is one of the largest suppliers of aircraft worldwide, competing with Airbus in the commercial aviation sector.
Ticker code: BA
Sector: Industrials | Industry: Aerospace & Defense | Website: https://www.boeing.com
Market Information
| Market Capitalisation | Enterprise Value | Shares Outstanding | Free Float [%] | Free Float Value |
|---|---|---|---|---|
| $167,375,510,403 | $200,764,509,059 | 756157695 | 95.79 | $160,323,980,082 |
Balance Sheet & Quality
| Equity | Cash | Debt | Return On Equity (ROE) | EBITDA 25 Margin [%] | Net Debt / Equity [%] | Rule of 40 |
|---|---|---|---|---|---|---|
| -$3,303,652,894 | $22,257,999,872 | $55,646,998,528 | 0.0 | 10.8 | -1010.7 | 8.1 |
Technicals & Short Data
| 3EMA Status | Volatility [%] | Value Traded Today | Average Daily Liquidity | Short [%] | Days To Cover |
|---|---|---|---|---|---|
| Partial | 2.6 | $1,021,115,026 | $1,617,972,036 | None | 0.0 |
Dividends
| Previous Dividend | Last Dividend | Franking [%] | Ex-Div Date | Gross Yield [%] |
|---|---|---|---|---|
| None | None | None | 2020-02-13 | 0.0 |
Price Performance Snapshot
| Last Traded Price | Change [%] | 1 Week [%] | 1 Month [%] | 3 Months [%] | 6 Months [%] | 12 Months [%] |
|---|---|---|---|---|---|---|
| $221.350 | 1.6 | 2.1 | None | -5.0 | 21.4 | 43.5 |
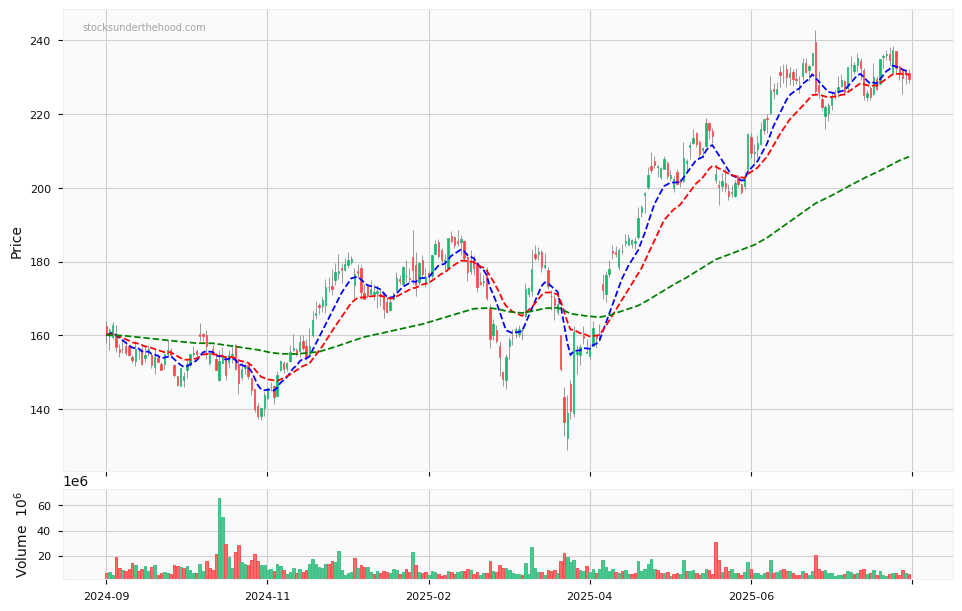
BA Price Chart with Volume and 3EMA
BA Short Positions
No chart available for this company.
Click HERE to understand why the above moving averages have been chosen.