Boss Energy Limited is involved in the exploration and development of uranium projects, primarily focusing on the Honeymoon Uranium Project in South Australia.
Ticker code: BOE
Sector: Energy | Industry: Uranium | Website: https://www.bossenergy.com
Market Information
| Market Capitalisation | Enterprise Value | Shares Outstanding | Free Float [%] | Free Float Value |
|---|---|---|---|---|
| $734,411,067 | $687,153,067 | 414921511 | 94.13 | $691,271,760 |
Balance Sheet & Quality
| Equity | Cash | Debt | Return On Equity (ROE) | EBITDA 25 Margin [%] | Net Debt / Equity [%] | Rule of 40 |
|---|---|---|---|---|---|---|
| $483,798,474 | $47,748,000 | $490,000 | 2.6 | -15.3 | -9.8 | 202.4 |
Technicals & Short Data
| 3EMA Status | Volatility [%] | Value Traded Today | Average Daily Liquidity | Short [%] | Days To Cover |
|---|---|---|---|---|---|
| Partial | 8.5 | $20,524,707 | $16,303,505 | 23.25 | 10.5 |
Dividends
| Previous Dividend | Last Dividend | Franking [%] | Ex-Div Date | Gross Yield [%] |
|---|---|---|---|---|
| None | None | None | None | 0.0 |
Price Performance Snapshot
| Last Traded Price | Change [%] | 1 Week [%] | 1 Month [%] | 3 Months [%] | 6 Months [%] | 12 Months [%] |
|---|---|---|---|---|---|---|
| $1.770 | 8.6 | 5.0 | 1.4 | -10.2 | -53.9 | -30.6 |
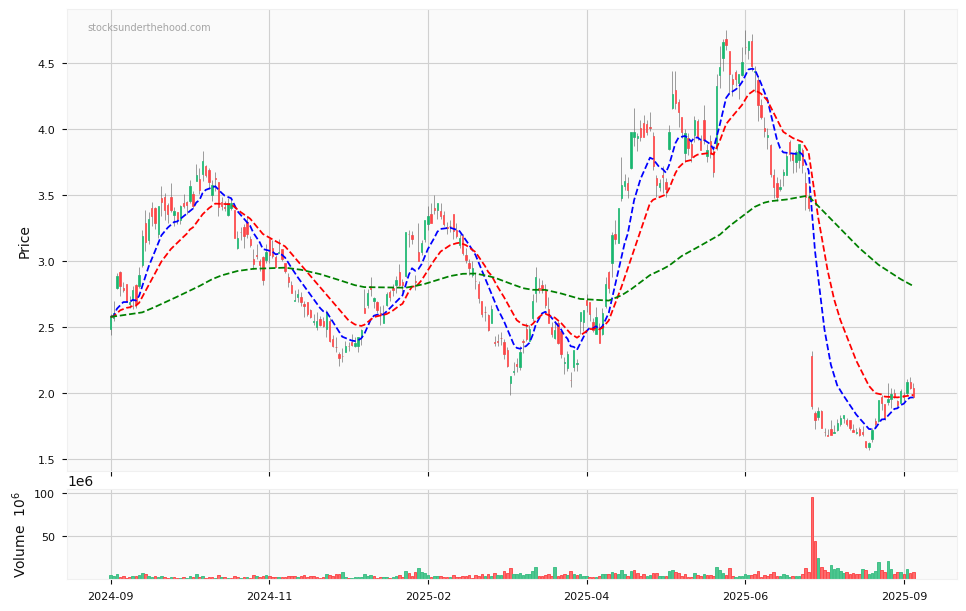
BOE Price Chart with Volume and 3EMA
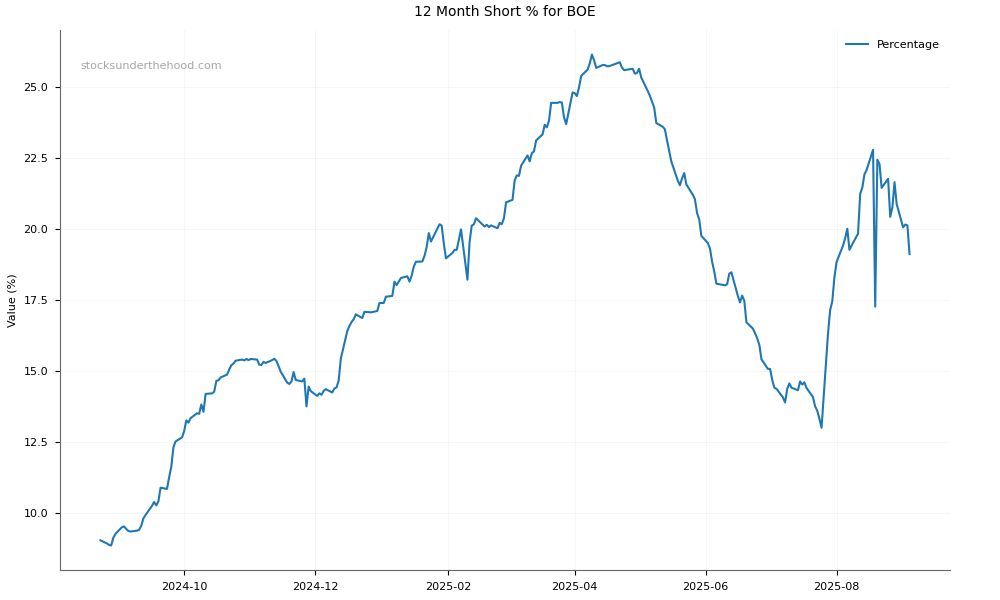
BOE Short Positions
Click HERE to understand why the above moving averages have been chosen.