Bravura Solutions Limited provides software solutions for the wealth management, life insurance, and funds administration industries, supporting financial institutions globally.
Ticker code: BVS
Sector: Technology | Industry: Software – Application | Website: https://www.bravurasolutions.com
Market Information
| Market Capitalisation | Enterprise Value | Shares Outstanding | Free Float [%] | Free Float Value |
|---|---|---|---|---|
| $1,205,926,958 | $1,160,557,958 | 448299975 | 69.29 | $835,562,672 |
Balance Sheet & Quality
| Equity | Cash | Debt | Return On Equity (ROE) | EBITDA 25 Margin [%] | Net Debt / Equity [%] | Rule of 40 |
|---|---|---|---|---|---|---|
| $93,694,700 | $58,685,000 | $13,316,000 | 23.9 | 33.9 | -48.4 | 36.1 |
Technicals & Short Data
| 3EMA Status | Volatility [%] | Value Traded Today | Average Daily Liquidity | Short [%] | Days To Cover |
|---|---|---|---|---|---|
| Partial | 8.5 | $3,776,747 | $6,376,998 | 2.2 | 4.2 |
Dividends
| Previous Dividend | Last Dividend | Franking [%] | Ex-Div Date | Gross Yield [%] |
|---|---|---|---|---|
| $0.105 | $0.047 | None | 2025-08-19 | 1.8 |
Price Performance Snapshot
| Last Traded Price | Change [%] | 1 Week [%] | 1 Month [%] | 3 Months [%] | 6 Months [%] | 12 Months [%] |
|---|---|---|---|---|---|---|
| $2.690 | 1.1 | 6.7 | -0.4 | 31.2 | 12.8 | 32.8 |
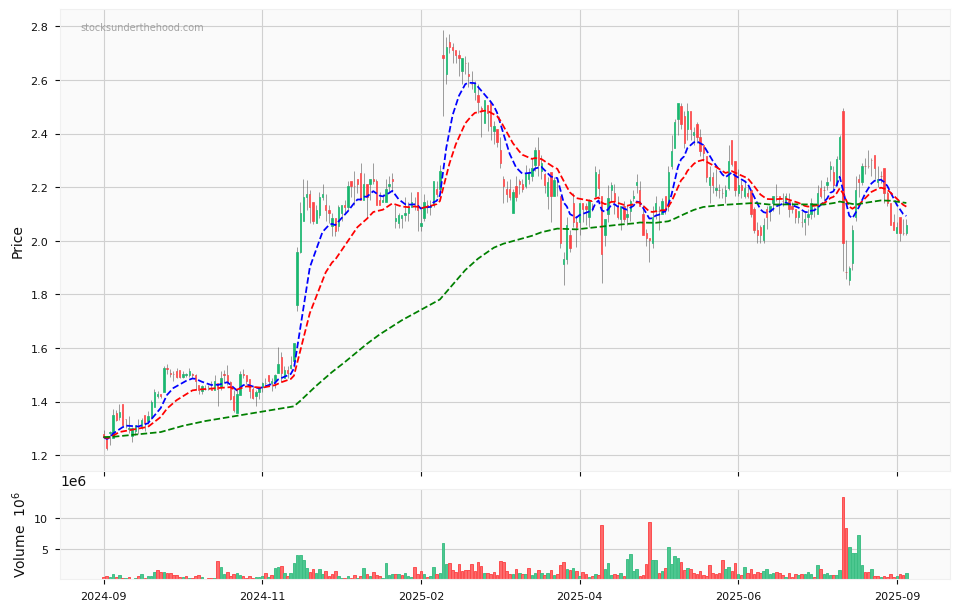
BVS Price Chart with Volume and 3EMA
BVS Short Positions

Click HERE to understand why the above moving averages have been chosen.