Charter Hall Group is a leading property investment and funds management company, managing a diversified portfolio of high-quality real estate assets across Australia.
Ticker code: CHC
Sector: Real Estate | Industry: REIT – Diversified | Website: https://www.charterhall.com.au
Market Information
| Market Capitalisation | Enterprise Value | Shares Outstanding | Free Float [%] | Free Float Value |
|---|---|---|---|---|
| $10,916,775,317 | $11,147,175,317 | 472997199 | 94.13 | $10,276,288,101 |
Balance Sheet & Quality
| Equity | Cash | Debt | Return On Equity (ROE) | EBITDA 25 Margin [%] | Net Debt / Equity [%] | Rule of 40 |
|---|---|---|---|---|---|---|
| $2,710,747,060 | $291,400,000 | $521,800,000 | 13.8 | 81.2 | 8.5 | 113.6 |
Technicals & Short Data
| 3EMA Status | Volatility [%] | Value Traded Today | Average Daily Liquidity | Short [%] | Days To Cover |
|---|---|---|---|---|---|
| Positive | 2.1 | $14,983,513 | $24,613,851 | 0.59 | 2.6 |
Dividends
| Previous Dividend | Last Dividend | Franking [%] | Ex-Div Date | Gross Yield [%] |
|---|---|---|---|---|
| $0.234 | $0.244 | 40.0 | 2025-06-27 | 1.2 |
Price Performance Snapshot
| Last Traded Price | Change [%] | 1 Week [%] | 1 Month [%] | 3 Months [%] | 6 Months [%] | 12 Months [%] |
|---|---|---|---|---|---|---|
| $23.080 | 0.4 | 0.6 | 2.6 | 18.2 | 41.1 | 56.5 |
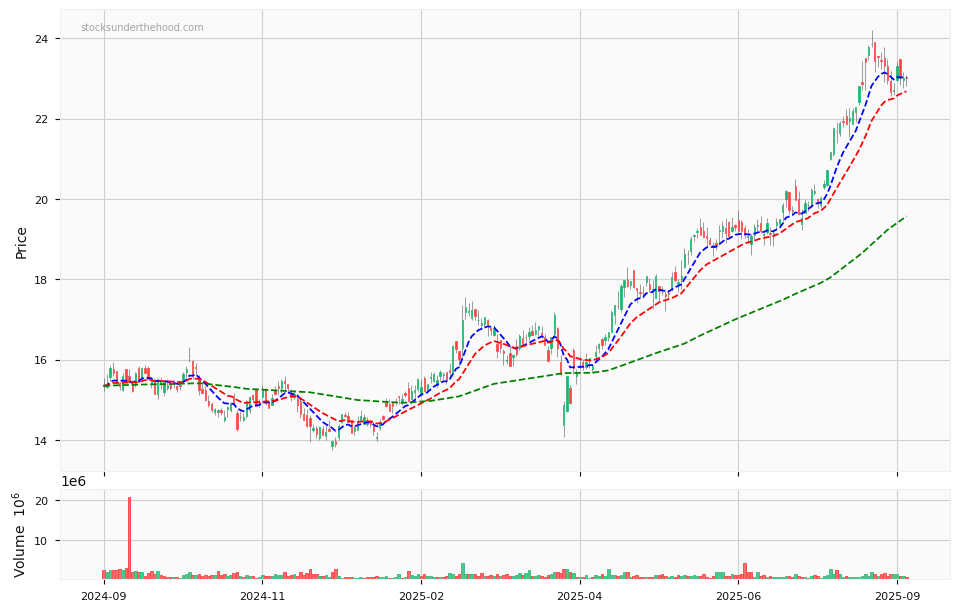
CHC Price Chart with Volume and 3EMA
CHC Short Positions

Click HERE to understand why the above moving averages have been chosen.