COG Financial Services Limited provides equipment finance broking and lending services to small and medium-sized enterprises in Australia, supporting business growth and operations.
Ticker code: COG
Sector: Financial Services | Industry: Capital Markets | Website: https://www.cogfs.com.au
Market Information
| Market Capitalisation | Enterprise Value | Shares Outstanding | Free Float [%] | Free Float Value |
|---|---|---|---|---|
| $404,648,872 | $631,374,856 | 211858052 | 72.95 | $295,204,736 |
Balance Sheet & Quality
| Equity | Cash | Debt | Return On Equity (ROE) | EBITDA 25 Margin [%] | Net Debt / Equity [%] | Rule of 40 |
|---|---|---|---|---|---|---|
| $159,529,116 | $149,251,008 | $375,976,992 | 14.9 | 15.6 | 142.1 | -16.0 |
Technicals & Short Data
| 3EMA Status | Volatility [%] | Value Traded Today | Average Daily Liquidity | Short [%] | Days To Cover |
|---|---|---|---|---|---|
| Partial | 9.2 | $284,076 | $385,081 | 0.0 | 0.0 |
Dividends
| Previous Dividend | Last Dividend | Franking [%] | Ex-Div Date | Gross Yield [%] |
|---|---|---|---|---|
| $0.030 | $0.030 | 100.0 | 2025-09-01 | 2.2 |
Price Performance Snapshot
| Last Traded Price | Change [%] | 1 Week [%] | 1 Month [%] | 3 Months [%] | 6 Months [%] | 12 Months [%] |
|---|---|---|---|---|---|---|
| $1.910 | -3.5 | -11.2 | -19.7 | -5.0 | 24.6 | 121.3 |
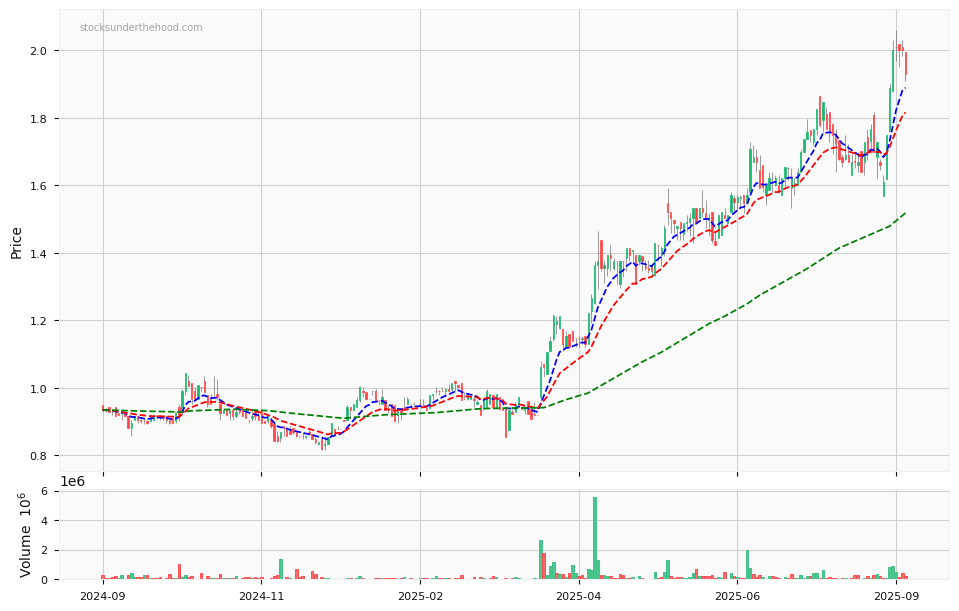
COG Price Chart with Volume and 3EMA
COG Short Positions

Click HERE to understand why the above moving averages have been chosen.