Cyclopharm Limited manufactures and distributes medical equipment and radiopharmaceuticals, including products for nuclear medicine and respiratory diagnostics.
Ticker code: CYC
Sector: Healthcare | Industry: Medical Distribution | Website: https://www.cyclomedica.com/company/cyclopharm/
Market Information
| Market Capitalisation | Enterprise Value | Shares Outstanding | Free Float [%] | Free Float Value |
|---|---|---|---|---|
| $111,136,850 | $106,705,374 | 111136850 | 50.88 | $56,551,986 |
Balance Sheet & Quality
| Equity | Cash | Debt | Return On Equity (ROE) | EBITDA 25 Margin [%] | Net Debt / Equity [%] | Rule of 40 |
|---|---|---|---|---|---|---|
| $36,119,476 | $12,410,539 | $7,979,063 | -3.1 | -32.3 | -12.3 | None |
Technicals & Short Data
| 3EMA Status | Volatility [%] | Value Traded Today | Average Daily Liquidity | Short [%] | Days To Cover |
|---|---|---|---|---|---|
| Positive | 19.4 | $12,149 | $88,599 | 0.13 | 1.6 |
Dividends
| Previous Dividend | Last Dividend | Franking [%] | Ex-Div Date | Gross Yield [%] |
|---|---|---|---|---|
| None | None | None | 2023-09-01 | 0.0 |
Price Performance Snapshot
| Last Traded Price | Change [%] | 1 Week [%] | 1 Month [%] | 3 Months [%] | 6 Months [%] | 12 Months [%] |
|---|---|---|---|---|---|---|
| $1.000 | 2.0 | 2.0 | 51.5 | 14.9 | -4.8 | -37.1 |
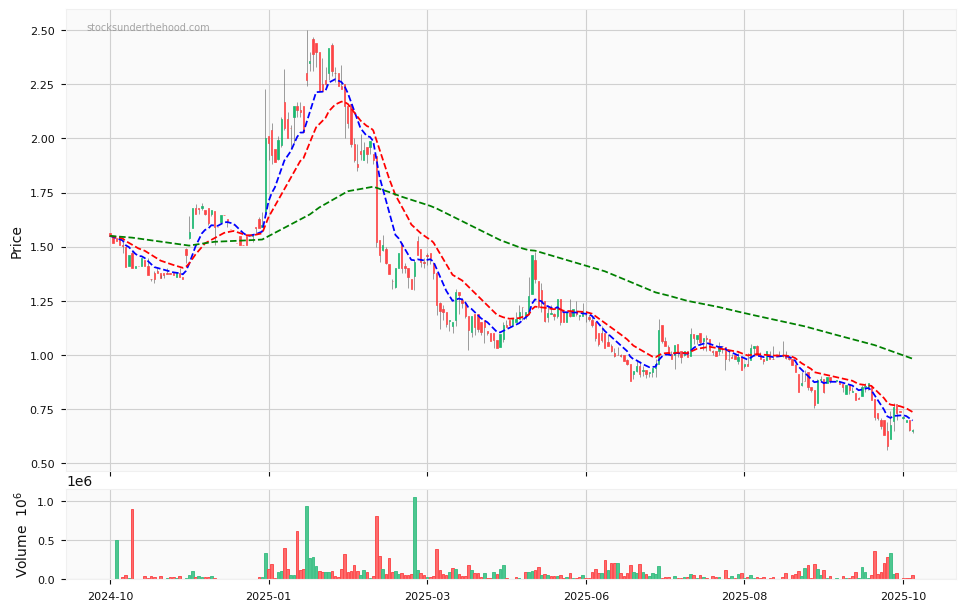
CYC Price Chart with Volume and 3EMA
CYC Short Positions

Click HERE to understand why the above moving averages have been chosen.