Coventry Group Ltd supplies industrial products and services, including fasteners, fluid systems, and gasket materials, to various industries across Australia and New Zealand.
Ticker code: CYG
Sector: Industrials | Industry: Industrial Distribution | Website: https://www.cgl.com.au
Market Information
| Market Capitalisation | Enterprise Value | Shares Outstanding | Free Float [%] | Free Float Value |
|---|---|---|---|---|
| $79,962,867 | $217,537,867 | 139065859 | 53.0 | $42,383,991 |
Balance Sheet & Quality
| Equity | Cash | Debt | Return On Equity (ROE) | EBITDA 25 Margin [%] | Net Debt / Equity [%] | Rule of 40 |
|---|---|---|---|---|---|---|
| $129,609,376 | $3,335,000 | $140,910,000 | 10.8 | None | 106.1 | None |
Technicals & Short Data
| 3EMA Status | Volatility [%] | Value Traded Today | Average Daily Liquidity | Short [%] | Days To Cover |
|---|---|---|---|---|---|
| Negative | 3.0 | $91,735 | $28,603 | 0.0 | 0.0 |
Dividends
| Previous Dividend | Last Dividend | Franking [%] | Ex-Div Date | Gross Yield [%] |
|---|---|---|---|---|
| None | None | 100.0 | 2024-09-27 | 0.0 |
Price Performance Snapshot
| Last Traded Price | Change [%] | 1 Week [%] | 1 Month [%] | 3 Months [%] | 6 Months [%] | 12 Months [%] |
|---|---|---|---|---|---|---|
| $0.575 | -3.4 | -4.2 | -1.7 | -28.1 | -33.9 | -58.3 |
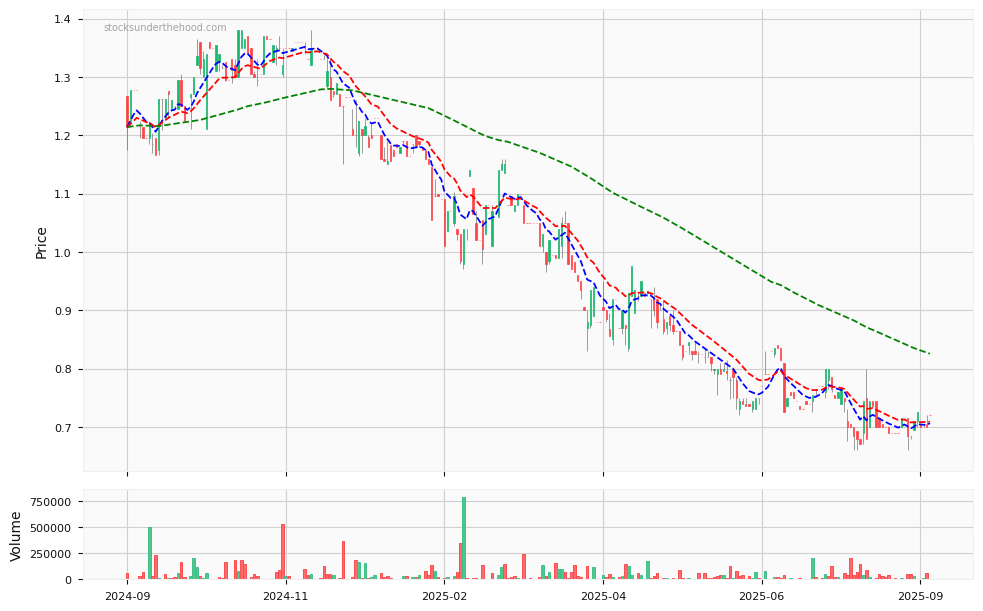
CYG Price Chart with Volume and 3EMA
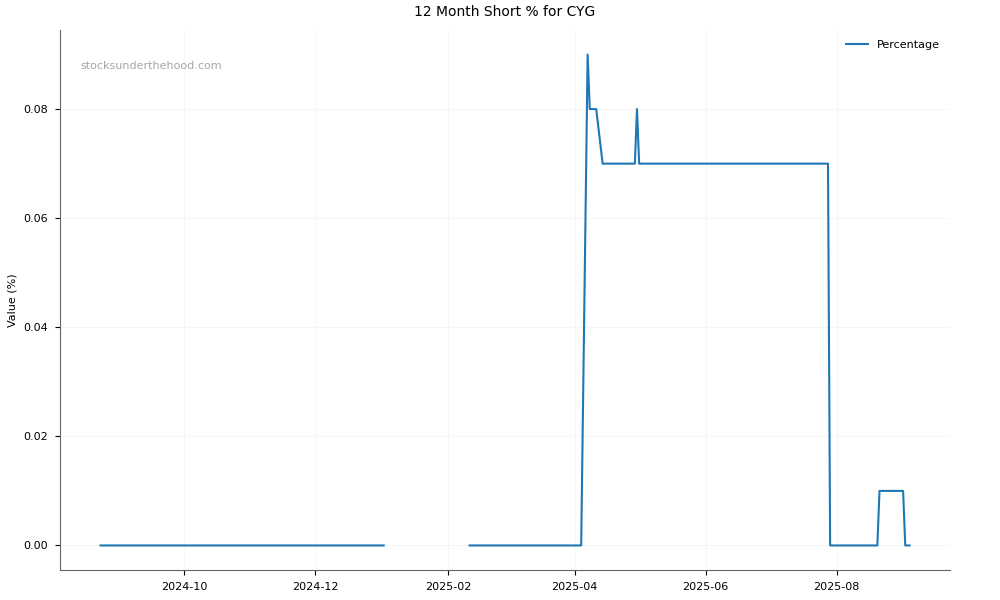
CYG Short Positions
Click HERE to understand why the above moving averages have been chosen.