Duratec Limited specializes in the protection and remediation of steel and concrete structures, offering asset protection solutions across various sectors in Australia.
Ticker code: DUR
Sector: Industrials | Industry: Engineering & Construction | Website: https://www.duratec.com.au
Market Information
| Market Capitalisation | Enterprise Value | Shares Outstanding | Free Float [%] | Free Float Value |
|---|---|---|---|---|
| $546,641,409 | $512,006,409 | 257849735 | 47.92 | $261,960,919 |
Balance Sheet & Quality
| Equity | Cash | Debt | Return On Equity (ROE) | EBITDA 25 Margin [%] | Net Debt / Equity [%] | Rule of 40 |
|---|---|---|---|---|---|---|
| $75,807,822 | $84,026,000 | $49,391,000 | 33.0 | 9.2 | -45.7 | 11.0 |
Technicals & Short Data
| 3EMA Status | Volatility [%] | Value Traded Today | Average Daily Liquidity | Short [%] | Days To Cover |
|---|---|---|---|---|---|
| Positive | 5.0 | $239,002 | $903,391 | 0.0 | 0.0 |
Dividends
| Previous Dividend | Last Dividend | Franking [%] | Ex-Div Date | Gross Yield [%] |
|---|---|---|---|---|
| $0.018 | $0.025 | 100.0 | 2025-09-16 | 1.7 |
Price Performance Snapshot
| Last Traded Price | Change [%] | 1 Week [%] | 1 Month [%] | 3 Months [%] | 6 Months [%] | 12 Months [%] |
|---|---|---|---|---|---|---|
| $2.120 | 2.4 | 1.9 | 3.4 | 44.6 | 31.3 | 32.4 |
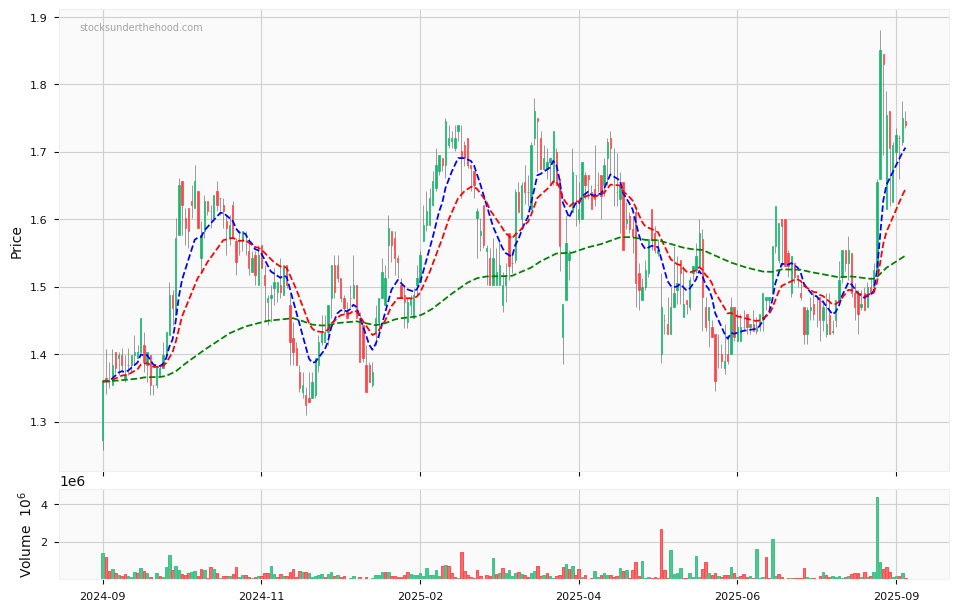
DUR Price Chart with Volume and 3EMA
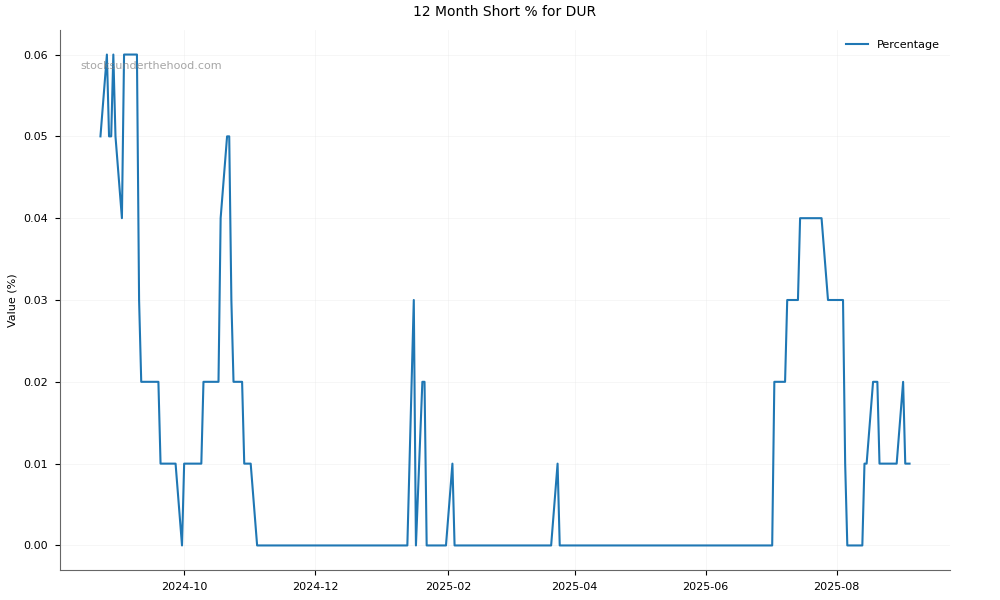
DUR Short Positions
Click HERE to understand why the above moving averages have been chosen.