Deep Yellow Limited is a uranium exploration and development company with projects in Namibia, aiming to become a low-cost producer of uranium for the global market.
Ticker code: DYL
Sector: Energy | Industry: Uranium | Website: https://deepyellow.com.au
Market Information
| Market Capitalisation | Enterprise Value | Shares Outstanding | Free Float [%] | Free Float Value |
|---|---|---|---|---|
| $1,884,684,873 | $1,670,588,660 | 973997379 | 91.57 | $1,725,831,242 |
Balance Sheet & Quality
| Equity | Cash | Debt | Return On Equity (ROE) | EBITDA 25 Margin [%] | Net Debt / Equity [%] | Rule of 40 |
|---|---|---|---|---|---|---|
| $634,072,303 | $217,369,120 | $3,272,907 | -1.5 | -388.1 | -33.8 | None |
Technicals & Short Data
| 3EMA Status | Volatility [%] | Value Traded Today | Average Daily Liquidity | Short [%] | Days To Cover |
|---|---|---|---|---|---|
| Positive | 6.7 | $8,188,248 | $10,954,203 | 7.05 | 12.1 |
Dividends
| Previous Dividend | Last Dividend | Franking [%] | Ex-Div Date | Gross Yield [%] |
|---|---|---|---|---|
| None | None | None | None | 0.0 |
Price Performance Snapshot
| Last Traded Price | Change [%] | 1 Week [%] | 1 Month [%] | 3 Months [%] | 6 Months [%] | 12 Months [%] |
|---|---|---|---|---|---|---|
| $1.935 | 4.9 | 11.8 | 16.9 | 1.3 | 45.5 | 55.4 |
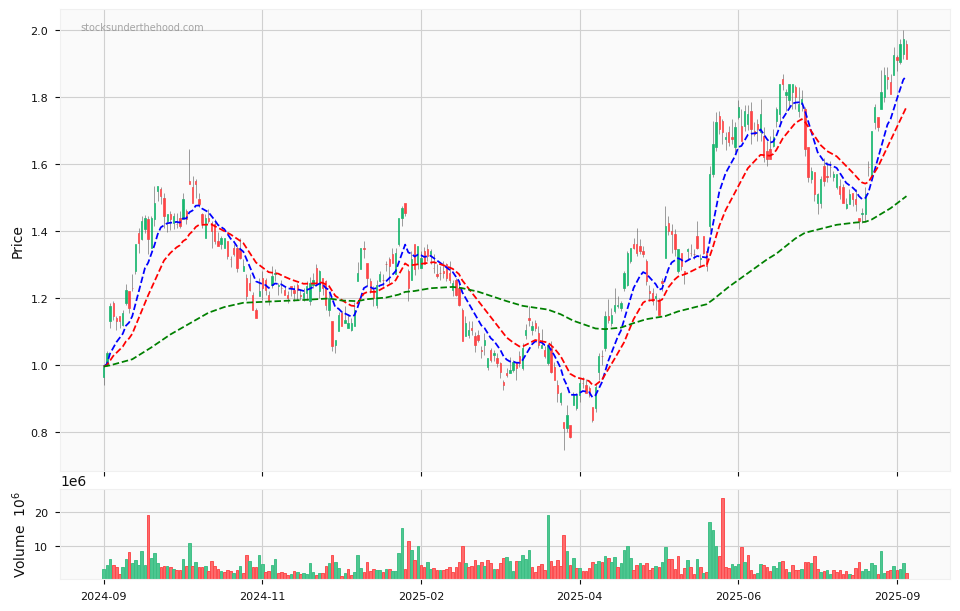
DYL Price Chart with Volume and 3EMA
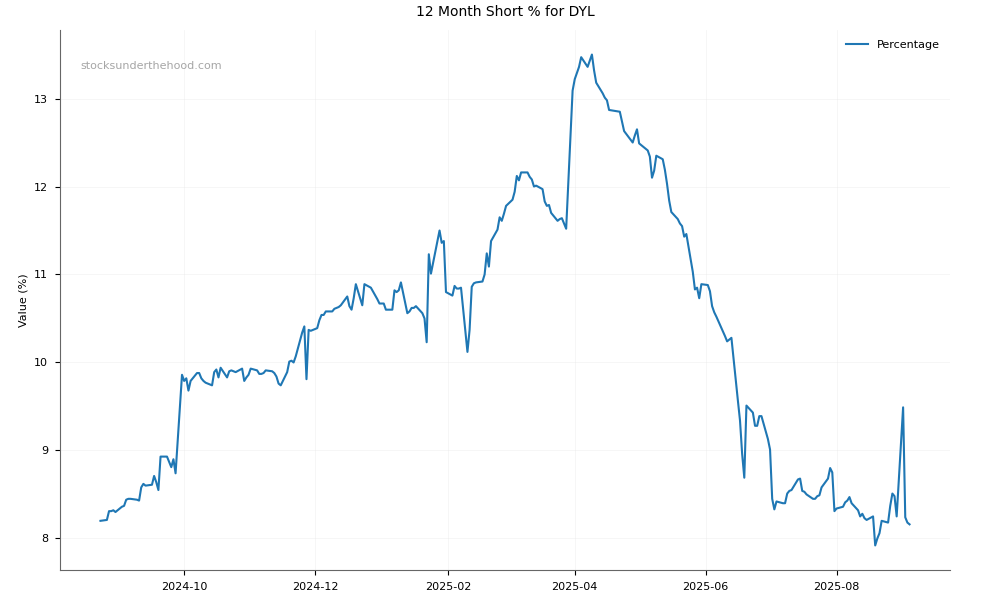
DYL Short Positions
Click HERE to understand why the above moving averages have been chosen.