Elders Limited is an agribusiness company providing a range of services to Australian farmers, including real estate, insurance, and agricultural supplies.
Ticker code: ELD
Sector: Consumer Defensive | Industry: Farm Products | Website: https://elders.com.au
Market Information
| Market Capitalisation | Enterprise Value | Shares Outstanding | Free Float [%] | Free Float Value |
|---|---|---|---|---|
| $1,492,447,091 | $2,039,848,083 | 213511751 | 98.66 | $1,472,478,150 |
Balance Sheet & Quality
| Equity | Cash | Debt | Return On Equity (ROE) | EBITDA 25 Margin [%] | Net Debt / Equity [%] | Rule of 40 |
|---|---|---|---|---|---|---|
| $1,206,554,878 | $46,732,000 | $594,132,992 | 11.2 | 8.3 | 45.4 | -13.0 |
Technicals & Short Data
| 3EMA Status | Volatility [%] | Value Traded Today | Average Daily Liquidity | Short [%] | Days To Cover |
|---|---|---|---|---|---|
| Negative | 9.5 | $1,805,957 | $5,956,507 | 4.8 | 12.0 |
Dividends
| Previous Dividend | Last Dividend | Franking [%] | Ex-Div Date | Gross Yield [%] |
|---|---|---|---|---|
| $0.180 | $0.180 | 30.0 | 2025-11-25 | 2.8 |
Price Performance Snapshot
| Last Traded Price | Change [%] | 1 Week [%] | 1 Month [%] | 3 Months [%] | 6 Months [%] | 12 Months [%] |
|---|---|---|---|---|---|---|
| $6.990 | 0.4 | -1.4 | 3.5 | -6.6 | 17.0 | -0.7 |
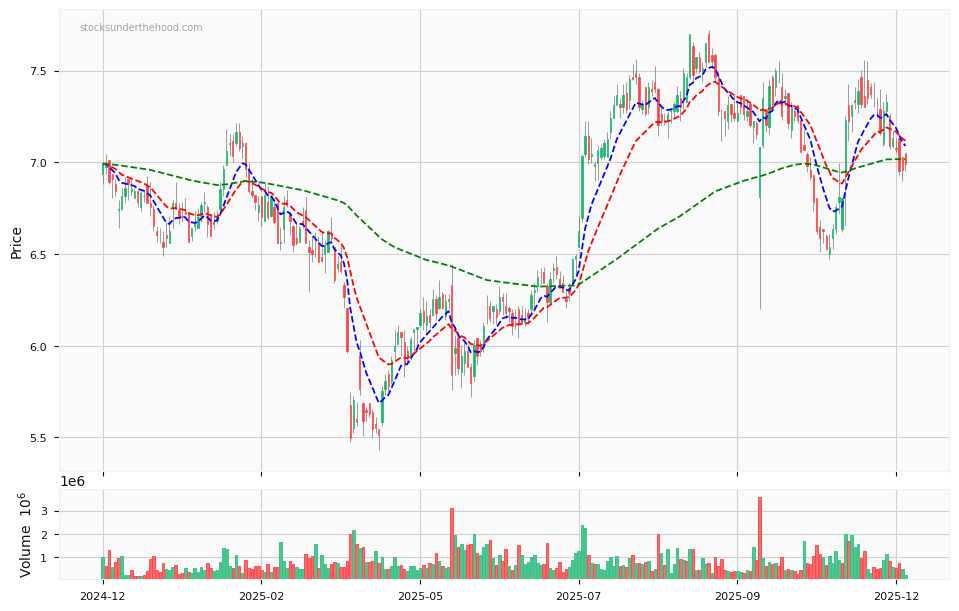
ELD Price Chart with Volume and 3EMA
ELD Short Positions

Click HERE to understand why the above moving averages have been chosen.