Fenix Resources Limited is an iron ore producer, operating the Iron Ridge Project in Western Australia and supplying high-grade iron ore to global markets.
Ticker code: FEX
Sector: Basic Materials | Industry: Steel | Website: https://fenix.com.au
Market Information
| Market Capitalisation | Enterprise Value | Shares Outstanding | Free Float [%] | Free Float Value |
|---|---|---|---|---|
| $357,347,768 | $383,452,768 | 744474534 | 60.62 | $216,617,493 |
Balance Sheet & Quality
| Equity | Cash | Debt | Return On Equity (ROE) | EBITDA 25 Margin [%] | Net Debt / Equity [%] | Rule of 40 |
|---|---|---|---|---|---|---|
| $178,673,884 | $56,820,000 | $82,925,000 | 4.0 | 17.2 | 14.6 | 46.1 |
Technicals & Short Data
| 3EMA Status | Volatility [%] | Value Traded Today | Average Daily Liquidity | Short [%] | Days To Cover |
|---|---|---|---|---|---|
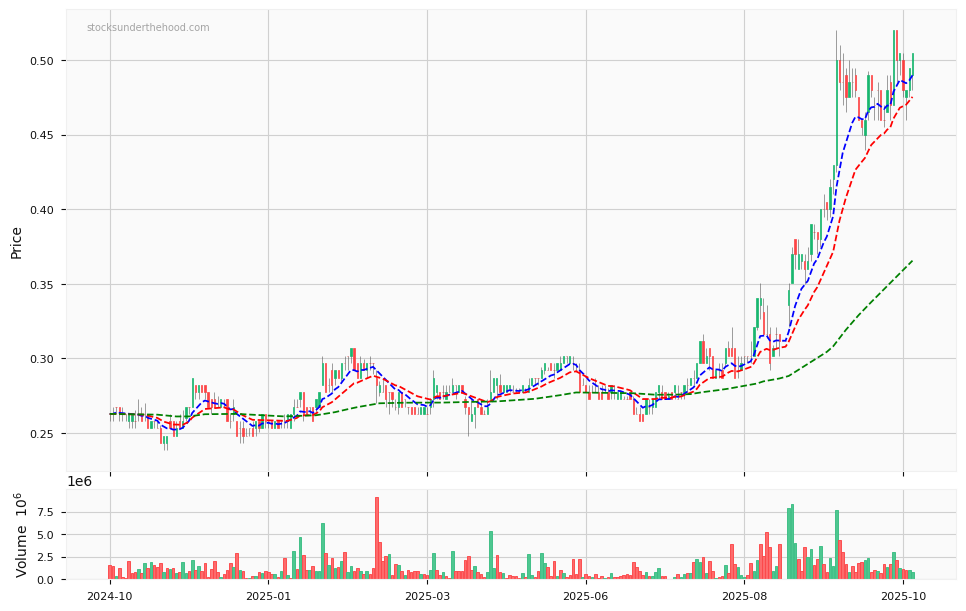
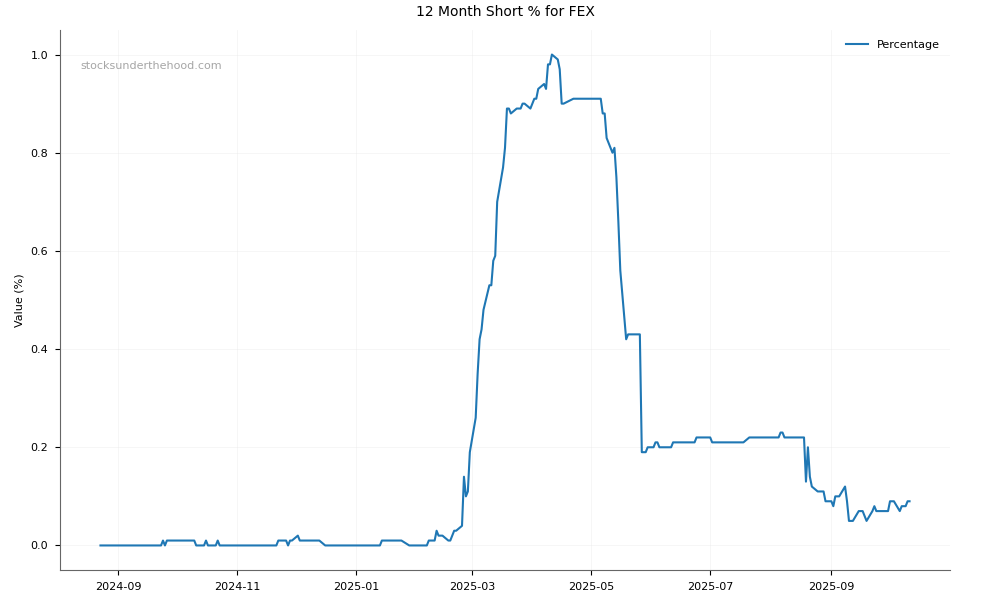
| Positive | 10.9 | $972,729 | $890,482 | 0.02 | 0.1 |
Dividends
| Previous Dividend | Last Dividend | Franking [%] | Ex-Div Date | Gross Yield [%] |
|---|---|---|---|---|
| $0.020 | $0.010 | 100.0 | 2025-09-03 | 0.0 |
Price Performance Snapshot
| Last Traded Price | Change [%] | 1 Week [%] | 1 Month [%] | 3 Months [%] | 6 Months [%] | 12 Months [%] |
|---|---|---|---|---|---|---|
| $0.480 | -4.0 | 4.3 | 7.9 | 29.7 | 76.1 | 79.3 |
FEX Price Chart with Volume and 3EMA
FEX Short Positions
Click HERE to understand why the above moving averages have been chosen.