Goodman Group is an integrated commercial and industrial property group that owns, develops, and manages real estate, including warehouses and logistics facilities, globally.
Ticker code: GMG
Sector: Real Estate | Industry: REIT – Diversified | Website: https://www.goodman.com
Market Information
| Market Capitalisation | Enterprise Value | Shares Outstanding | Free Float [%] | Free Float Value |
|---|---|---|---|---|
| $69,584,304,519 | $70,902,204,295 | 2044793036 | 97.32 | $67,718,326,638 |
Balance Sheet & Quality
| Equity | Cash | Debt | Return On Equity (ROE) | EBITDA 25 Margin [%] | Net Debt / Equity [%] | Rule of 40 |
|---|---|---|---|---|---|---|
| $23,466,043,457 | $3,957,100,032 | $5,274,999,808 | 9.6 | 81.5 | 5.6 | 93.7 |
Technicals & Short Data
| 3EMA Status | Volatility [%] | Value Traded Today | Average Daily Liquidity | Short [%] | Days To Cover |
|---|---|---|---|---|---|
| Positive | 2.1 | $39,625,688 | $103,042,292 | 0.36 | 2.4 |
Dividends
| Previous Dividend | Last Dividend | Franking [%] | Ex-Div Date | Gross Yield [%] |
|---|---|---|---|---|
| $0.150 | $0.150 | None | 2025-06-27 | 0.4 |
Price Performance Snapshot
| Last Traded Price | Change [%] | 1 Week [%] | 1 Month [%] | 3 Months [%] | 6 Months [%] | 12 Months [%] |
|---|---|---|---|---|---|---|
| $34.030 | 0.5 | 0.3 | 3.5 | -2.3 | 18.0 | -6.4 |
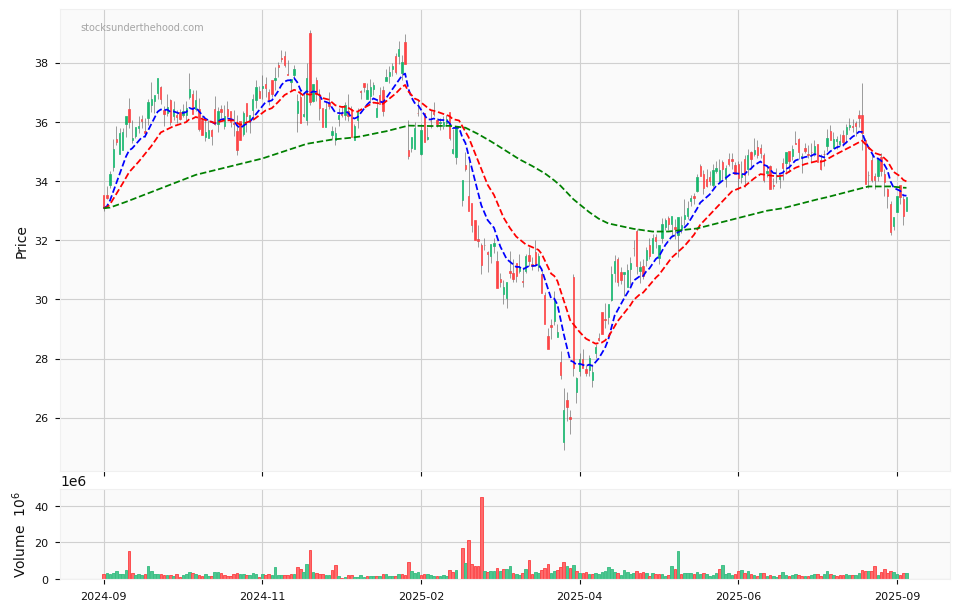
GMG Price Chart with Volume and 3EMA
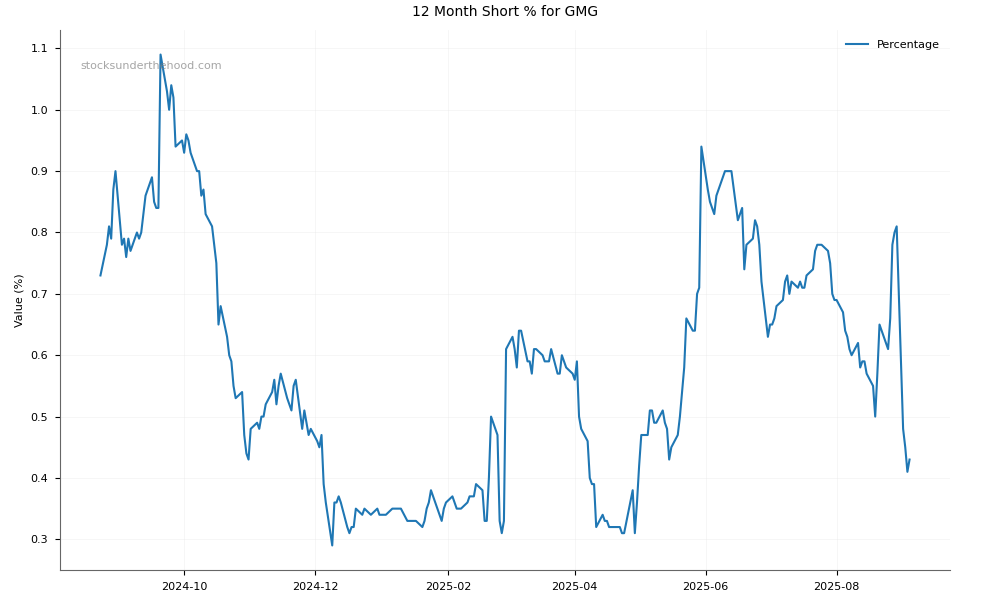
GMG Short Positions
Click HERE to understand why the above moving averages have been chosen.