HiTech Group Australia Limited provides recruitment and information technology services, specializing in the placement of professionals in the IT and telecommunications sectors.
Ticker code: HIT
Sector: Industrials | Industry: Staffing & Employment Services | Website: https://www.hitechaust.com
Market Information
| Market Capitalisation | Enterprise Value | Shares Outstanding | Free Float [%] | Free Float Value |
|---|---|---|---|---|
| $71,698,502 | $62,491,724 | 42300000 | 22.2 | $15,915,634 |
Balance Sheet & Quality
| Equity | Cash | Debt | Return On Equity (ROE) | EBITDA 25 Margin [%] | Net Debt / Equity [%] | Rule of 40 |
|---|---|---|---|---|---|---|
| $11,547,900 | $9,652,671 | $445,893 | 0.0 | None | -79.7 | None |
Technicals & Short Data
| 3EMA Status | Volatility [%] | Value Traded Today | Average Daily Liquidity | Short [%] | Days To Cover |
|---|---|---|---|---|---|
| Negative | 2.0 | $6,273 | $20,047 | 0.0 | 0.0 |
Dividends
| Previous Dividend | Last Dividend | Franking [%] | Ex-Div Date | Gross Yield [%] |
|---|---|---|---|---|
| $0.050 | $0.050 | 100.0 | 2025-09-03 | 4.2 |
Price Performance Snapshot
| Last Traded Price | Change [%] | 1 Week [%] | 1 Month [%] | 3 Months [%] | 6 Months [%] | 12 Months [%] |
|---|---|---|---|---|---|---|
| $1.695 | -0.3 | -4.8 | -7.1 | -2.6 | 8.7 | -9.1 |
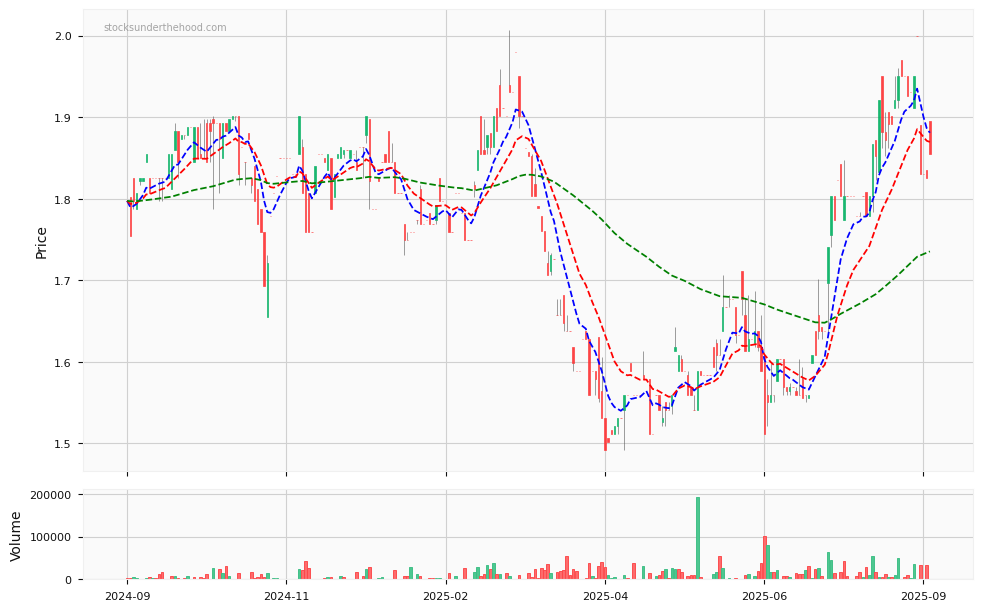
HIT Price Chart with Volume and 3EMA
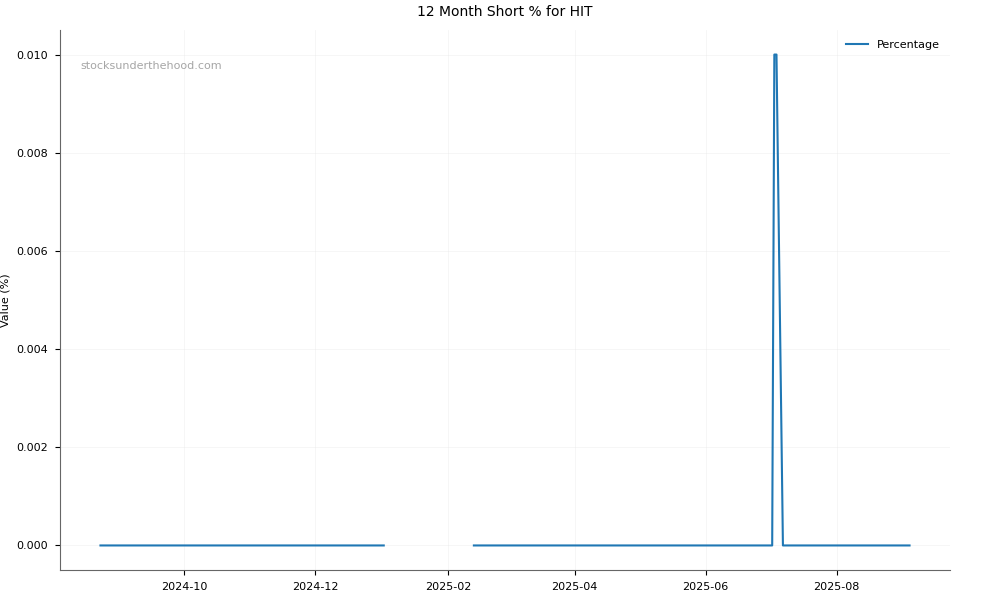
HIT Short Positions
Click HERE to understand why the above moving averages have been chosen.