Helia Group Limited, formerly known as Genworth Mortgage Insurance Australia, offers lenders mortgage insurance solutions, helping Australians achieve homeownership by mitigating lender risk.
Ticker code: ASX:hli
Sector: Financial Services | Industry: Insurance – Specialty | Website: https://helia.com.au
Market Information
| Market Capitalisation | Enterprise Value | Shares Outstanding | Free Float [%] | Free Float Value |
|---|---|---|---|---|
| $1,586,342,979 | -$1,008,441,024 | 272100000 | 96.83 | $1,536,040,043 |
Balance Sheet & Quality
| Equity | Cash | Debt | Return On Equity (ROE) | EBITDA 24 Margin [%] | Net Debt / Equity [%] | Rule of 40 |
|---|---|---|---|---|---|---|
| $1,022,007,569 | $2,779,899,904 | $196,000,000 | 22.7 | 100.9 | -252.8 | None |
Technicals & Short Data
| 3EMA Status | Volatility [%] | Value Traded Today | Average Daily Liquidity | Short [%] | Days To Cover |
|---|---|---|---|---|---|
| Positive | 3.5 | $4,518,646 | $5,945,813 | 2.61 | 7.0 |
Dividends
| Previous Dividend | Last Dividend | Franking [%] | Ex-Div Date | Gross Yield [%] |
|---|---|---|---|---|
| $0.160 | $0.160 | 100.0 | 2025-08-29 | 7.8 |
Price Performance Snapshot
| Last Traded Price | Change [%] | 1 Week [%] | 1 Month [%] | 3 Months [%] | 6 Months [%] | 12 Months [%] |
|---|---|---|---|---|---|---|
| $5.830 | 0.7 | 4.9 | 13.9 | 12.4 | 11.5 | 58.5 |
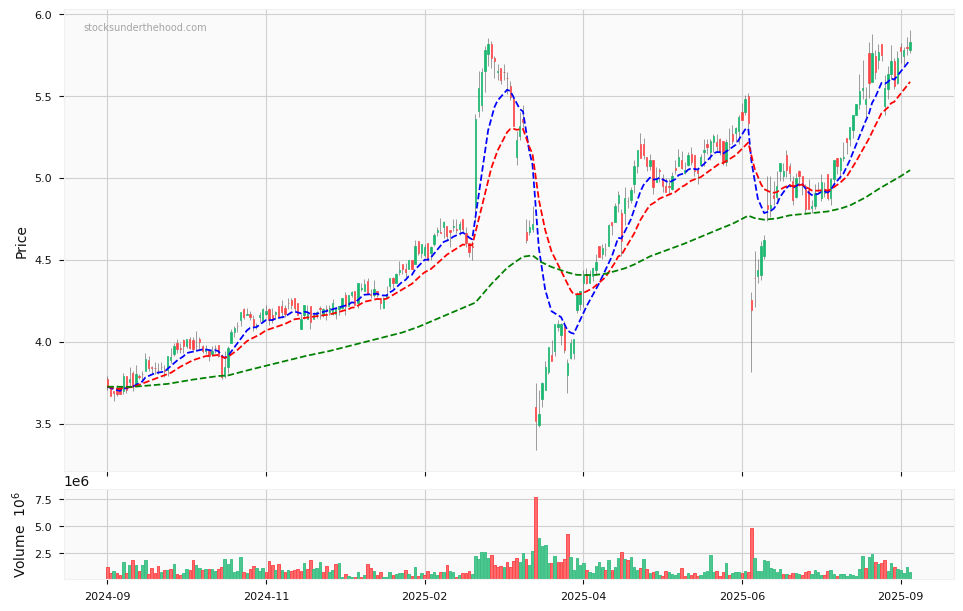
ASX:hli Price Chart with Volume and 3EMA
ASX:hli Short Positions

Click HERE to understand why the above moving averages have been chosen.