HMC Capital Limited, formerly Home Consortium, is an alternative asset manager focused on real estate and private equity investments, managing a diverse portfolio of assets in Australia.
Ticker code: HMC
Sector: Real Estate | Industry: REIT – Diversified | Website: https://www.hmccapital.com.au
Market Information
| Market Capitalisation | Enterprise Value | Shares Outstanding | Free Float [%] | Free Float Value |
|---|---|---|---|---|
| $1,341,001,126 | $813,801,158 | 412615731 | 64.51 | $865,028,398 |
Balance Sheet & Quality
| Equity | Cash | Debt | Return On Equity (ROE) | EBITDA 25 Margin [%] | Net Debt / Equity [%] | Rule of 40 |
|---|---|---|---|---|---|---|
| $1,659,127,757 | $665,299,968 | $138,100,000 | 11.9 | 65.4 | -31.8 | 176.5 |
Technicals & Short Data
| 3EMA Status | Volatility [%] | Value Traded Today | Average Daily Liquidity | Short [%] | Days To Cover |
|---|---|---|---|---|---|
| Negative | 4.9 | $6,170,678 | $8,840,861 | 4.59 | 7.0 |
Dividends
| Previous Dividend | Last Dividend | Franking [%] | Ex-Div Date | Gross Yield [%] |
|---|---|---|---|---|
| $0.060 | $0.060 | 50.0 | 2025-08-26 | 2.2 |
Price Performance Snapshot
| Last Traded Price | Change [%] | 1 Week [%] | 1 Month [%] | 3 Months [%] | 6 Months [%] | 12 Months [%] |
|---|---|---|---|---|---|---|
| $3.250 | 1.6 | 2.8 | -0.9 | -10.8 | -29.5 | -67.5 |
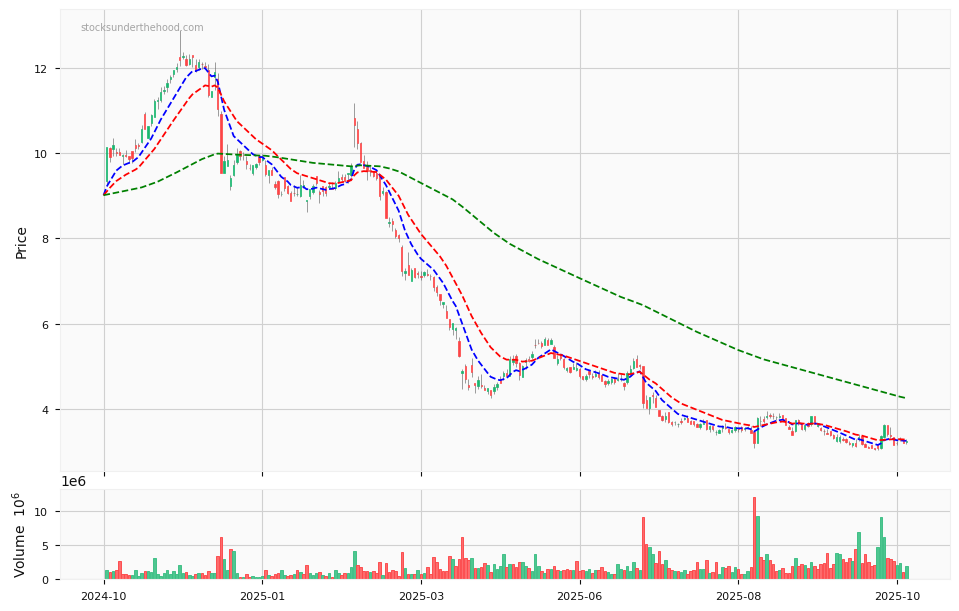
HMC Price Chart with Volume and 3EMA
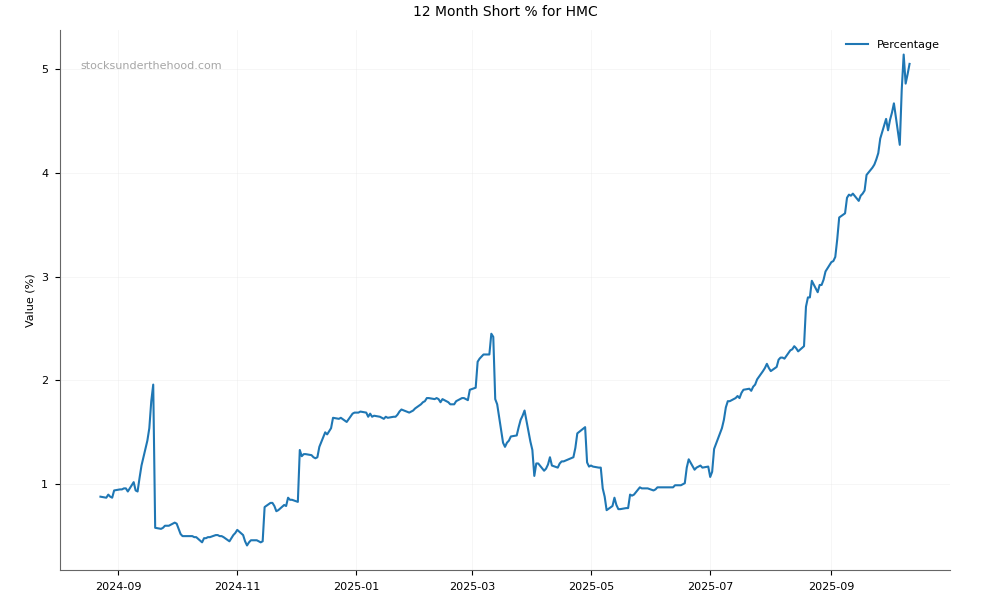
HMC Short Positions
Click HERE to understand why the above moving averages have been chosen.