Infomedia Ltd develops and supplies electronic parts catalogs and service quoting software systems for the automotive industry, serving clients globally with innovative solutions.
Ticker code: IFM
Sector: Technology | Industry: Software – Application | Website: https://www.infomedia.com.au
Market Information
| Market Capitalisation | Enterprise Value | Shares Outstanding | Free Float [%] | Free Float Value |
|---|---|---|---|---|
| $640,161,301 | $563,068,301 | 379917699 | 82.62 | $528,918,375 |
Balance Sheet & Quality
| Equity | Cash | Debt | Return On Equity (ROE) | EBITDA 25 Margin [%] | Net Debt / Equity [%] | Rule of 40 |
|---|---|---|---|---|---|---|
| $143,988,812 | $84,640,000 | $7,547,000 | 15.7 | 39.5 | -53.5 | 42.8 |
Technicals & Short Data
| 3EMA Status | Volatility [%] | Value Traded Today | Average Daily Liquidity | Short [%] | Days To Cover |
|---|---|---|---|---|---|
| Positive | 0.6 | $531,026 | $4,135,430 | 0.02 | 0.0 |
Dividends
| Previous Dividend | Last Dividend | Franking [%] | Ex-Div Date | Gross Yield [%] |
|---|---|---|---|---|
| $0.022 | $0.020 | 68.0 | 2025-08-29 | 1.5 |
Price Performance Snapshot
| Last Traded Price | Change [%] | 1 Week [%] | 1 Month [%] | 3 Months [%] | 6 Months [%] | 12 Months [%] |
|---|---|---|---|---|---|---|
| $1.685 | None | 0.3 | None | 33.2 | 31.7 | 20.2 |
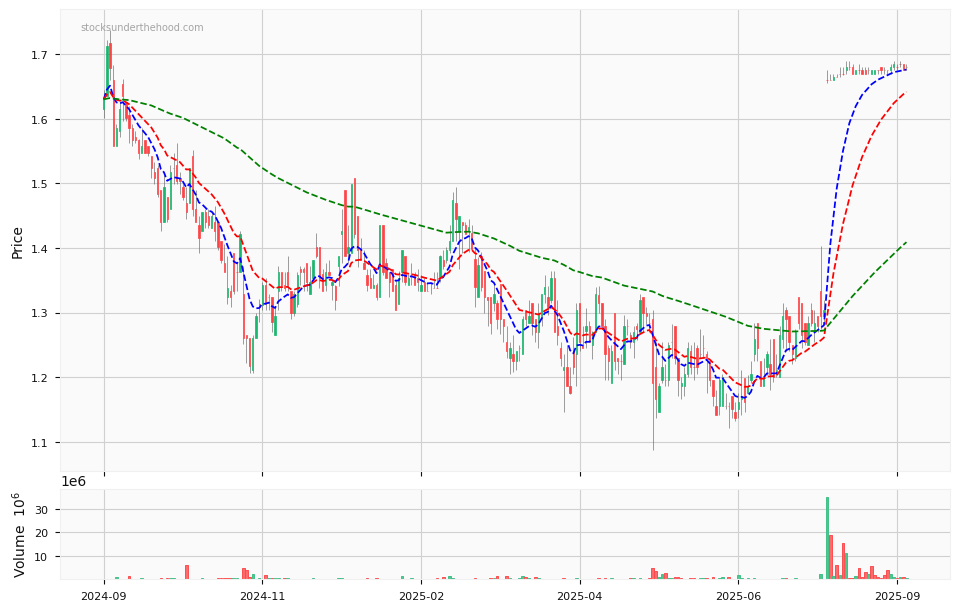
IFM Price Chart with Volume and 3EMA
IFM Short Positions

Click HERE to understand why the above moving averages have been chosen.