Ingenia Communities Group owns, operates, and develops a portfolio of lifestyle and holiday communities across Australia, catering to the growing seniors demographic with affordable accommodation options.
Ticker code: ASX:INA
Sector: Real Estate | Industry: REIT – Residential | Website: https://www.ingeniacommunities.com.au
Market Information
| Market Capitalisation | Enterprise Value | Shares Outstanding | Free Float [%] | Free Float Value |
|---|---|---|---|---|
| $2,249,951,992 | $3,148,141,312 | 407583008 | 94.15 | $2,118,218,634 |
Balance Sheet & Quality
| Equity | Cash | Debt | Return On Equity (ROE) | EBITDA 24 Margin [%] | Net Debt / Equity [%] | Rule of 40 |
|---|---|---|---|---|---|---|
| $1,595,687,455 | $13,365,000 | $879,040,000 | 6.2 | 27.5 | 54.3 | 37.1 |
Technicals & Short Data
| 3EMA Status | Volatility [%] | Value Traded Today | Average Daily Liquidity | Short [%] | Days To Cover |
|---|---|---|---|---|---|
| Partial | 2.9 | $4,601,698 | $7,035,074 | 1.45 | 4.6 |
Dividends
| Previous Dividend | Last Dividend | Franking [%] | Ex-Div Date | Gross Yield [%] |
|---|---|---|---|---|
| $0.052 | $0.044 | None | 2025-08-29 | 1.7 |
Price Performance Snapshot
| Last Traded Price | Change [%] | 1 Week [%] | 1 Month [%] | 3 Months [%] | 6 Months [%] | 12 Months [%] |
|---|---|---|---|---|---|---|
| $5.520 | -1.4 | -0.9 | 0.2 | -0.7 | 3.4 | 7.1 |
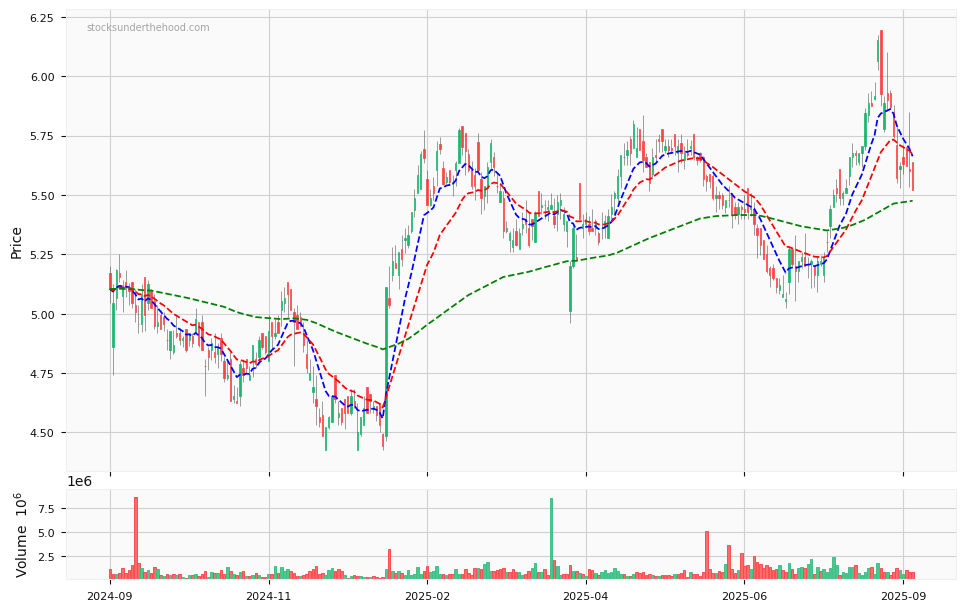
ASX:INA Price Chart with Volume and 3EMA
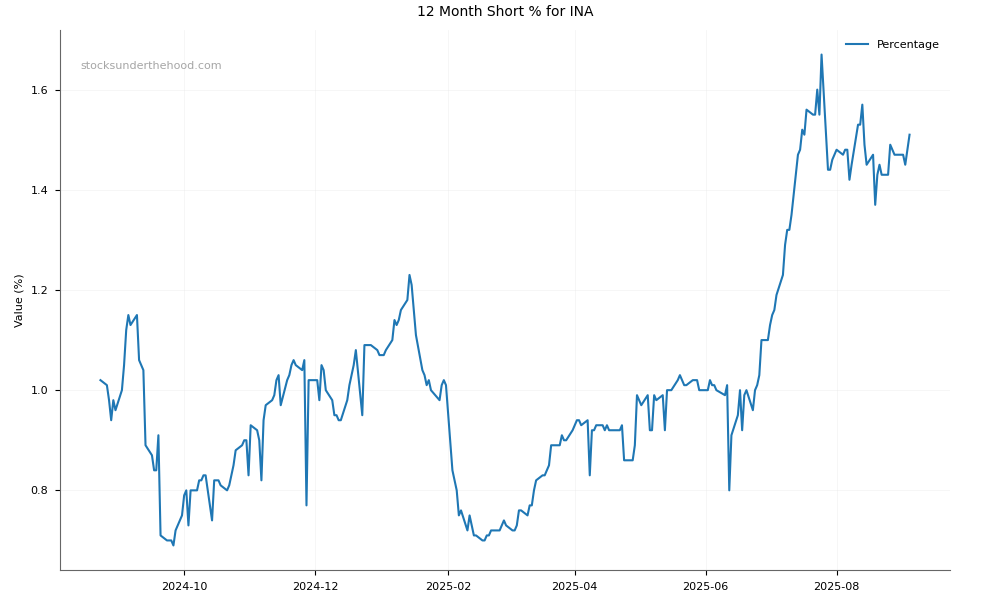
ASX:INA Short Positions
Click HERE to understand why the above moving averages have been chosen.