IPH Limited is an intellectual property services firm offering a range of IP services, including patents, trademarks, and legal advice, operating across the Asia-Pacific region.
Ticker code: IPH
Sector: Industrials | Industry: Specialty Business Services | Website: https://www.iphltd.com.au
Market Information
| Market Capitalisation | Enterprise Value | Shares Outstanding | Free Float [%] | Free Float Value |
|---|---|---|---|---|
| $886,419,461 | $1,301,419,461 | 261480659 | 95.99 | $850,865,605 |
Balance Sheet & Quality
| Equity | Cash | Debt | Return On Equity (ROE) | EBITDA 25 Margin [%] | Net Debt / Equity [%] | Rule of 40 |
|---|---|---|---|---|---|---|
| $701,814,076 | $59,000,000 | $474,000,000 | 16.3 | 28.5 | 59.1 | 45.6 |
Technicals & Short Data
| 3EMA Status | Volatility [%] | Value Traded Today | Average Daily Liquidity | Short [%] | Days To Cover |
|---|---|---|---|---|---|
| Negative | 4.9 | $4,998,955 | $5,467,884 | 9.56 | 15.5 |
Dividends
| Previous Dividend | Last Dividend | Franking [%] | Ex-Div Date | Gross Yield [%] |
|---|---|---|---|---|
| $0.170 | $0.195 | 45.0 | 2025-08-28 | 6.6 |
Price Performance Snapshot
| Last Traded Price | Change [%] | 1 Week [%] | 1 Month [%] | 3 Months [%] | 6 Months [%] | 12 Months [%] |
|---|---|---|---|---|---|---|
| $3.390 | -0.9 | -2.3 | -8.9 | -23.1 | -26.2 | -26.0 |
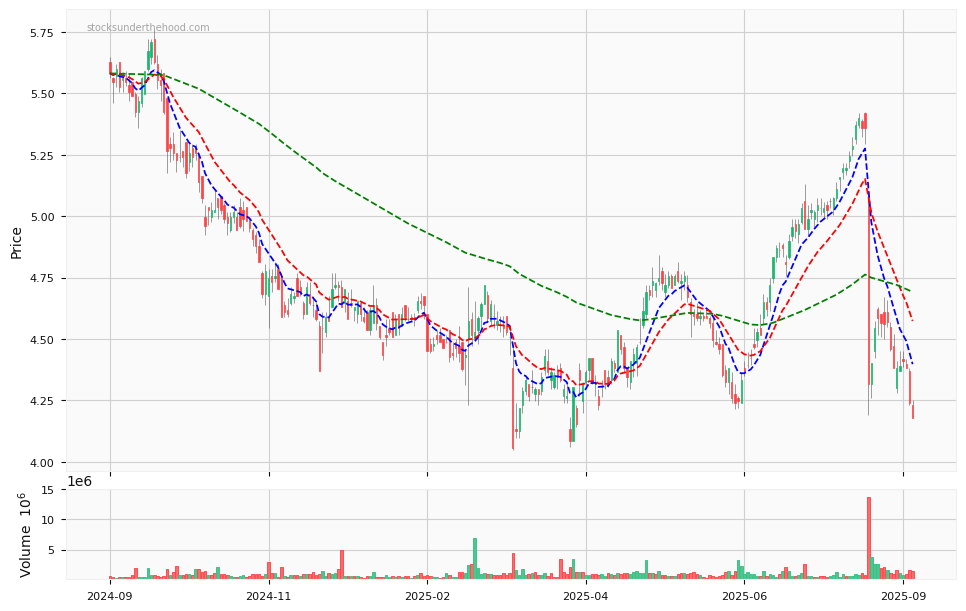
IPH Price Chart with Volume and 3EMA
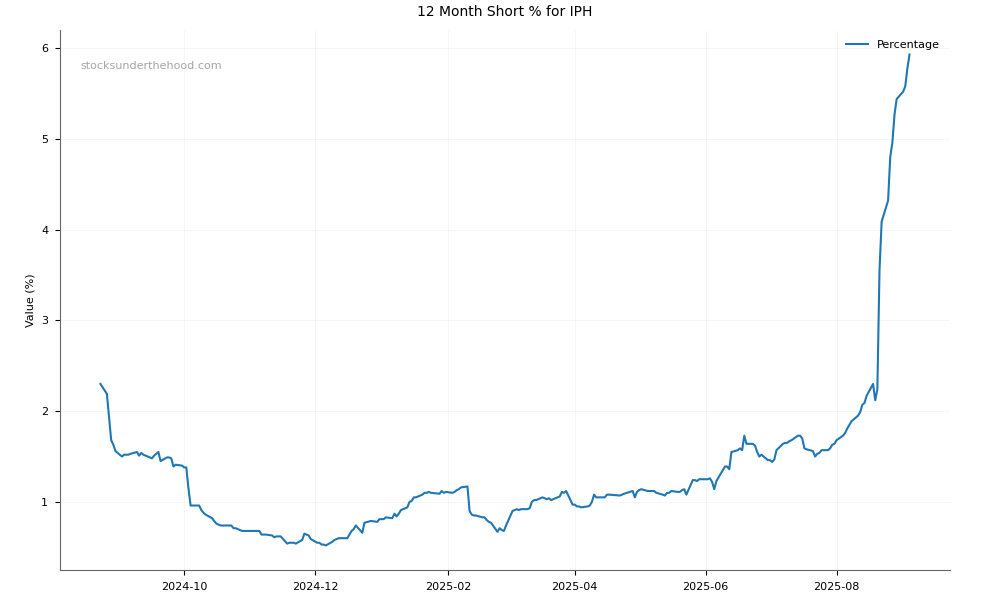
IPH Short Positions
Click HERE to understand why the above moving averages have been chosen.