Iress Limited provides software solutions for the financial services industry, including trading platforms, financial advice software, and market data services, serving clients globally.
Ticker code: IRE
Sector: Technology | Industry: Software – Application | Website: https://www.iress.com
Market Information
| Market Capitalisation | Enterprise Value | Shares Outstanding | Free Float [%] | Free Float Value |
|---|---|---|---|---|
| $1,610,125,245 | $1,760,974,253 | 186789474 | 98.88 | $1,592,016,763 |
Balance Sheet & Quality
| Equity | Cash | Debt | Return On Equity (ROE) | EBITDA 25 Margin [%] | Net Debt / Equity [%] | Rule of 40 |
|---|---|---|---|---|---|---|
| $389,082,452 | $40,842,000 | $191,691,008 | 17.3 | 23.9 | 38.8 | 22.9 |
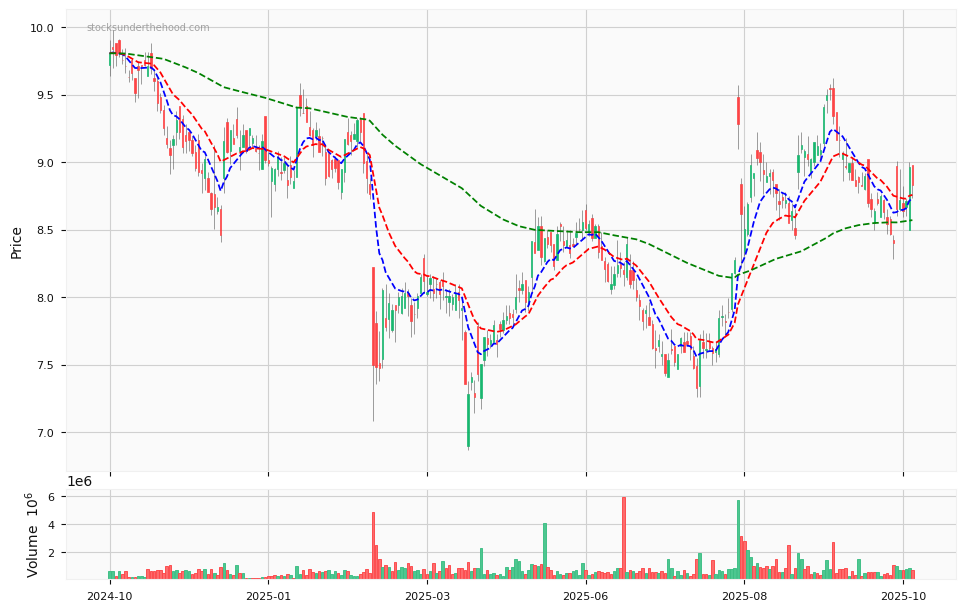
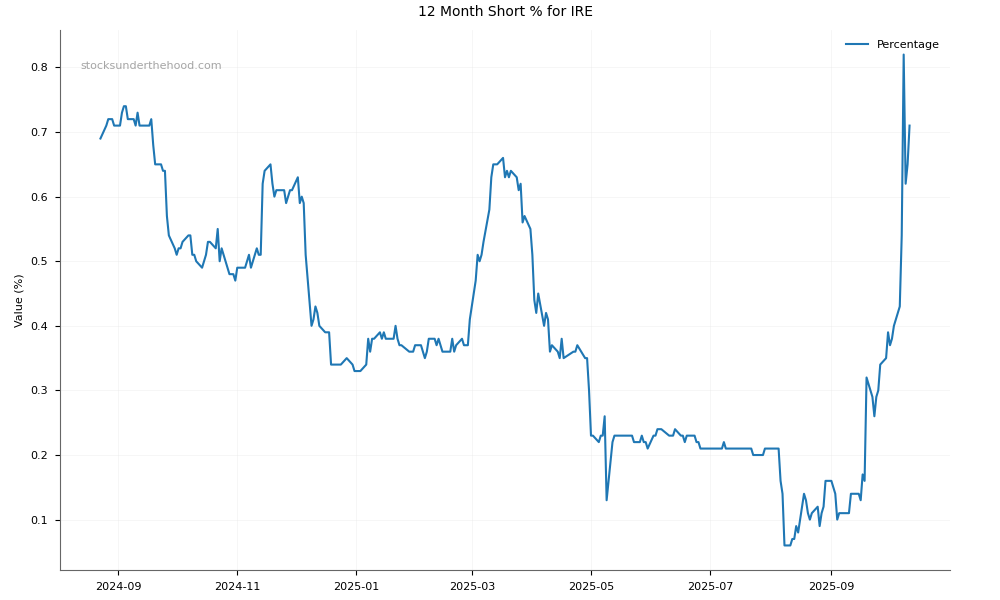
Technicals & Short Data
| 3EMA Status | Volatility [%] | Value Traded Today | Average Daily Liquidity | Short [%] | Days To Cover |
|---|---|---|---|---|---|
| Partial | 7.0 | $4,229,136 | $6,062,455 | 0.9 | 2.4 |
Dividends
| Previous Dividend | Last Dividend | Franking [%] | Ex-Div Date | Gross Yield [%] |
|---|---|---|---|---|
| $0.100 | $0.110 | 12.5 | 2025-08-22 | 1.3 |
Price Performance Snapshot
| Last Traded Price | Change [%] | 1 Week [%] | 1 Month [%] | 3 Months [%] | 6 Months [%] | 12 Months [%] |
|---|---|---|---|---|---|---|
| $8.620 | -0.7 | -2.8 | -6.9 | -5.6 | 3.4 | -0.5 |
IRE Price Chart with Volume and 3EMA
IRE Short Positions
Click HERE to understand why the above moving averages have been chosen.