Integrated Research Limited develops performance monitoring and diagnostics software for business-critical computing environments, specializing in systems for payments, communications, and infrastructure.
Ticker code: ASX:IRI
Sector: Technology | Industry: Software – Application | Website: https://www.ir.com
Market Information
| Market Capitalisation | Enterprise Value | Shares Outstanding | Free Float [%] | Free Float Value |
|---|---|---|---|---|
| $72,714,726 | $35,747,260 | 177352992 | 54.42 | $39,567,720 |
Balance Sheet & Quality
| Equity | Cash | Debt | Return On Equity (ROE) | EBITDA 24 Margin [%] | Net Debt / Equity [%] | Rule of 40 |
|---|---|---|---|---|---|---|
| $100,559,145 | $40,588,000 | $1,847,000 | 12.3 | 29.5 | -38.5 | 15.2 |
Technicals & Short Data
| 3EMA Status | Volatility [%] | Value Traded Today | Average Daily Liquidity | Short [%] | Days To Cover |
|---|---|---|---|---|---|
| Negative | 3.9 | $102,418 | $94,970 | 0.05 | 0.4 |
Dividends
| Previous Dividend | Last Dividend | Franking [%] | Ex-Div Date | Gross Yield [%] |
|---|---|---|---|---|
| $0.020 | $0.020 | 100.0 | 2025-09-03 | 13.9 |
Price Performance Snapshot
| Last Traded Price | Change [%] | 1 Week [%] | 1 Month [%] | 3 Months [%] | 6 Months [%] | 12 Months [%] |
|---|---|---|---|---|---|---|
| $0.410 | -2.4 | -2.4 | -6.7 | 2.2 | 11.5 | -31.3 |
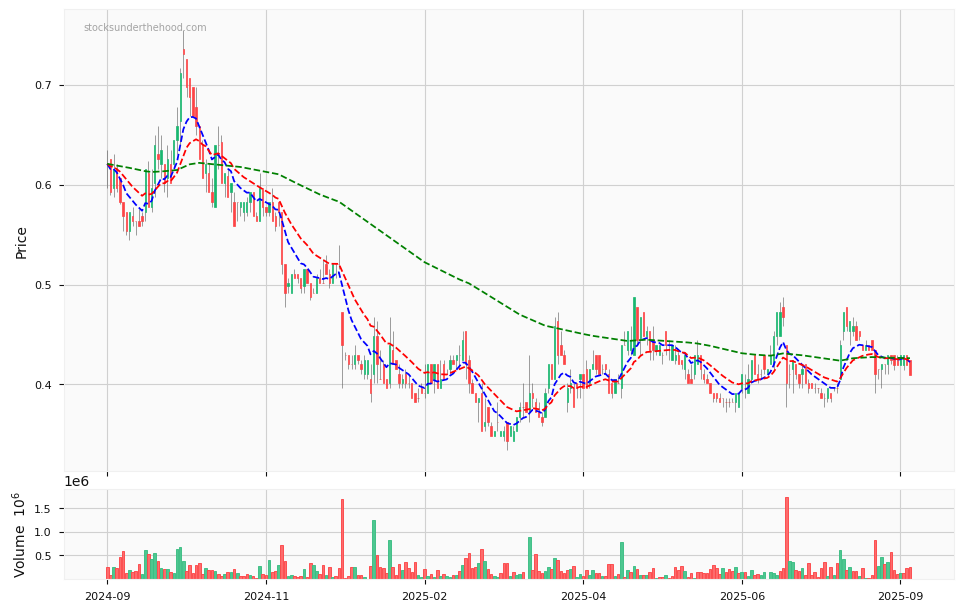
ASX:IRI Price Chart with Volume and 3EMA
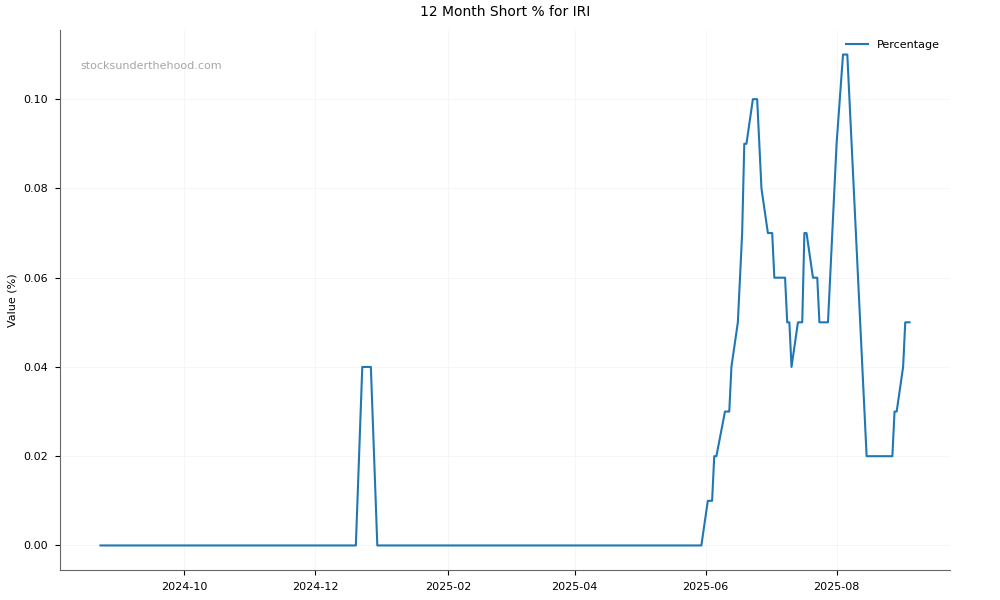
ASX:IRI Short Positions
Click HERE to understand why the above moving averages have been chosen.