Intelligent Monitoring Group Limited (ASX:IMB): Offers security monitoring and risk management solutions for residential and commercial clients.
Ticker code: IMB
Sector: Industrials | Industry: Security & Protection Services | Website: https://www.intelligentmonitoringgroup.com
Market Information
| Market Capitalisation | Enterprise Value | Shares Outstanding | Free Float [%] | Free Float Value |
|---|---|---|---|---|
| $241,483,272 | $313,072,272 | 377317621 | 86.93 | $209,916,815 |
Balance Sheet & Quality
| Equity | Cash | Debt | Return On Equity (ROE) | EBITDA 25 Margin [%] | Net Debt / Equity [%] | Rule of 40 |
|---|---|---|---|---|---|---|
| $33,958,587 | $23,965,000 | $95,554,000 | 67.7 | 20.6 | 210.8 | 30.2 |
Technicals & Short Data
| 3EMA Status | Volatility [%] | Value Traded Today | Average Daily Liquidity | Short [%] | Days To Cover |
|---|---|---|---|---|---|
| Partial | 8.4 | $735,453 | $294,065 | 0.01 | 0.1 |
Dividends
| Previous Dividend | Last Dividend | Franking [%] | Ex-Div Date | Gross Yield [%] |
|---|---|---|---|---|
| None | None | None | None | 0.0 |
Price Performance Snapshot
| Last Traded Price | Change [%] | 1 Week [%] | 1 Month [%] | 3 Months [%] | 6 Months [%] | 12 Months [%] |
|---|---|---|---|---|---|---|
| $0.640 | 8.5 | 10.3 | 9.4 | 8.5 | 12.3 | 23.1 |
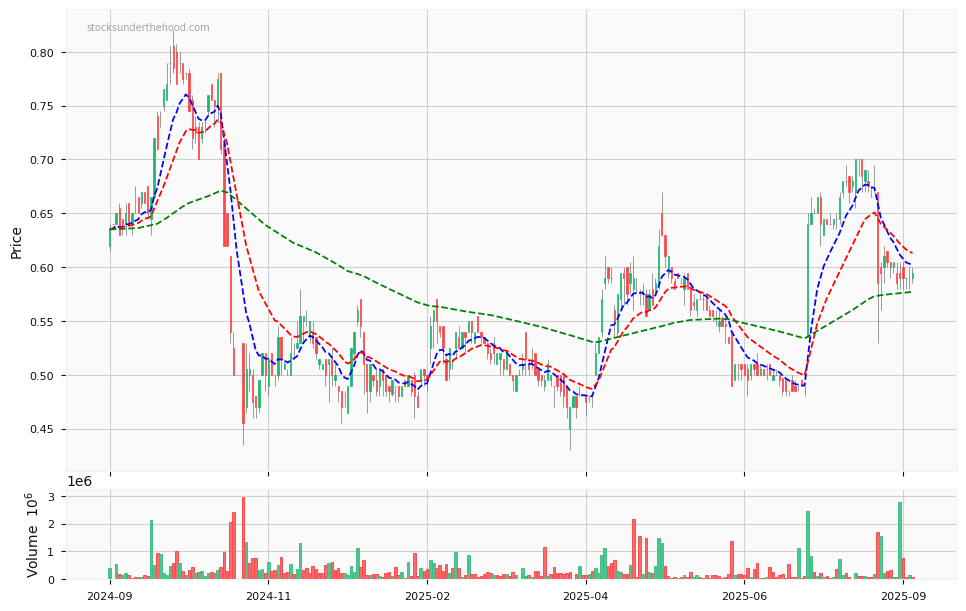
IMB Price Chart with Volume and 3EMA
IMB Short Positions

Click HERE to understand why the above moving averages have been chosen.