Janison Education Group Limited provides online assessment and learning platforms, delivering digital exam solutions and educational content to schools, governments, and organizations worldwide.
Ticker code: JAN
Sector: Technology | Industry: Software – Application | Website: https://www.janison.com
Market Information
| Market Capitalisation | Enterprise Value | Shares Outstanding | Free Float [%] | Free Float Value |
|---|---|---|---|---|
| $58,474,855 | $48,223,855 | 259888252 | 55.96 | $32,724,868 |
Balance Sheet & Quality
| Equity | Cash | Debt | Return On Equity (ROE) | EBITDA 25 Margin [%] | Net Debt / Equity [%] | Rule of 40 |
|---|---|---|---|---|---|---|
| $21,310,838 | $10,642,000 | $391,000 | -36.5 | 6.7 | -48.1 | 15.5 |
Technicals & Short Data
| 3EMA Status | Volatility [%] | Value Traded Today | Average Daily Liquidity | Short [%] | Days To Cover |
|---|---|---|---|---|---|
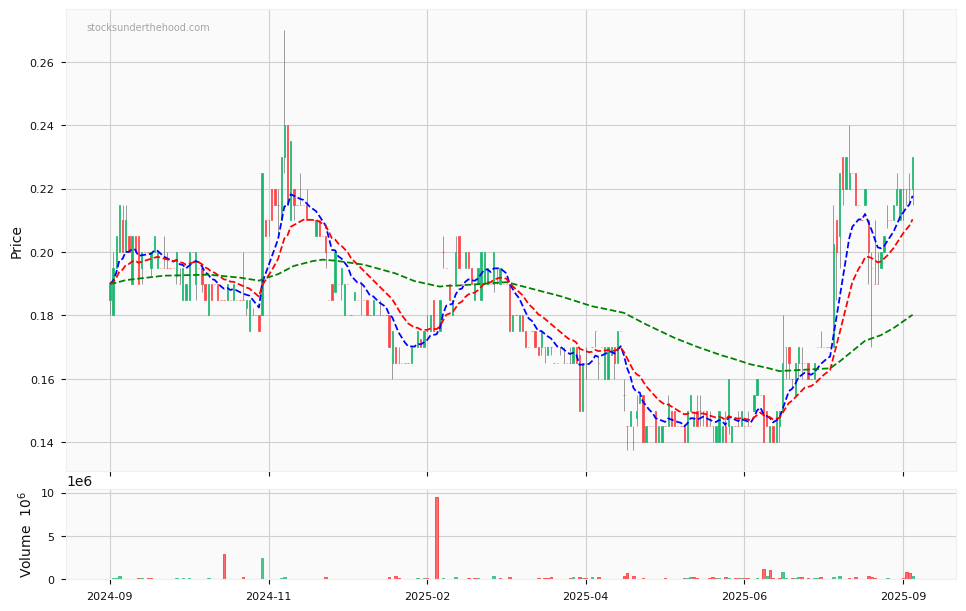
| Positive | 5.8 | $42,600 | $27,300 | 0.0 | 0.0 |
Dividends
| Previous Dividend | Last Dividend | Franking [%] | Ex-Div Date | Gross Yield [%] |
|---|---|---|---|---|
| None | None | 100.0 | 2006-11-30 | 0.0 |
Price Performance Snapshot
| Last Traded Price | Change [%] | 1 Week [%] | 1 Month [%] | 3 Months [%] | 6 Months [%] | 12 Months [%] |
|---|---|---|---|---|---|---|
| $0.225 | None | 2.3 | -6.3 | 40.6 | 32.4 | 21.6 |
JAN Price Chart with Volume and 3EMA
JAN Short Positions
Click HERE to understand why the above moving averages have been chosen.