Johns Lyng Group Limited is an integrated building services provider, specializing in insurance building and restoration services across Australia, New Zealand, and the United States.
Ticker code: JLG
Sector: Industrials | Industry: Engineering & Construction | Website: https://johnslyng.com.au
Market Information
| Market Capitalisation | Enterprise Value | Shares Outstanding | Free Float [%] | Free Float Value |
|---|---|---|---|---|
| $1,139,420,456 | $1,281,684,456 | 285569036 | 70.67 | $805,229,571 |
Balance Sheet & Quality
| Equity | Cash | Debt | Return On Equity (ROE) | EBITDA 25 Margin [%] | Net Debt / Equity [%] | Rule of 40 |
|---|---|---|---|---|---|---|
| $482,326,120 | $81,374,000 | $223,638,000 | 8.3 | 11.7 | 29.5 | 9.2 |
Technicals & Short Data
| 3EMA Status | Volatility [%] | Value Traded Today | Average Daily Liquidity | Short [%] | Days To Cover |
|---|---|---|---|---|---|
| Positive | 0.3 | $4,493,422 | $6,856,843 | 1.14 | 1.9 |
Dividends
| Previous Dividend | Last Dividend | Franking [%] | Ex-Div Date | Gross Yield [%] |
|---|---|---|---|---|
| $0.047 | None | 100.0 | 2025-02-28 | 0.0 |
Price Performance Snapshot
| Last Traded Price | Change [%] | 1 Week [%] | 1 Month [%] | 3 Months [%] | 6 Months [%] | 12 Months [%] |
|---|---|---|---|---|---|---|
| $3.990 | None | None | 1.0 | 2.0 | 86.4 | 4.6 |
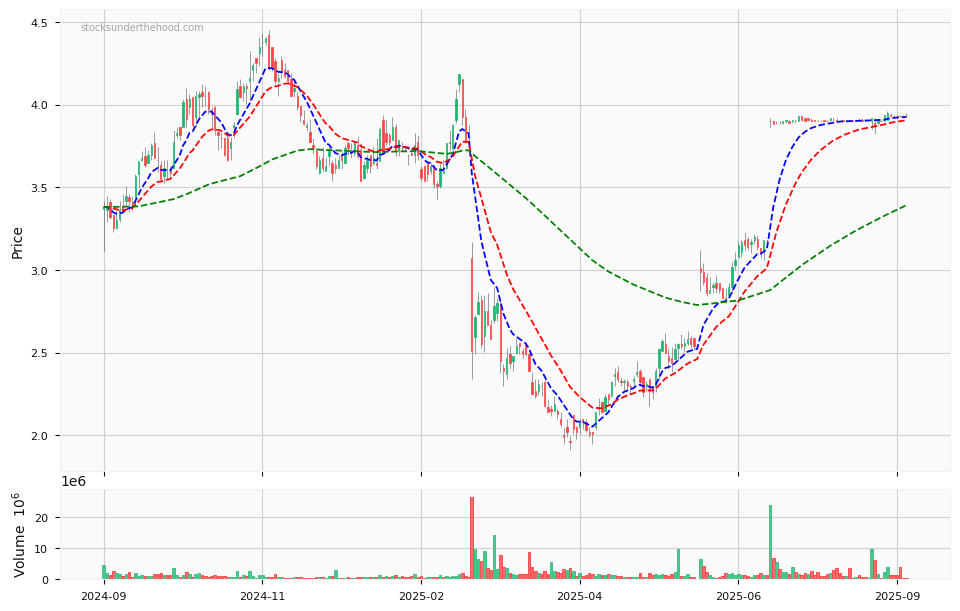
JLG Price Chart with Volume and 3EMA
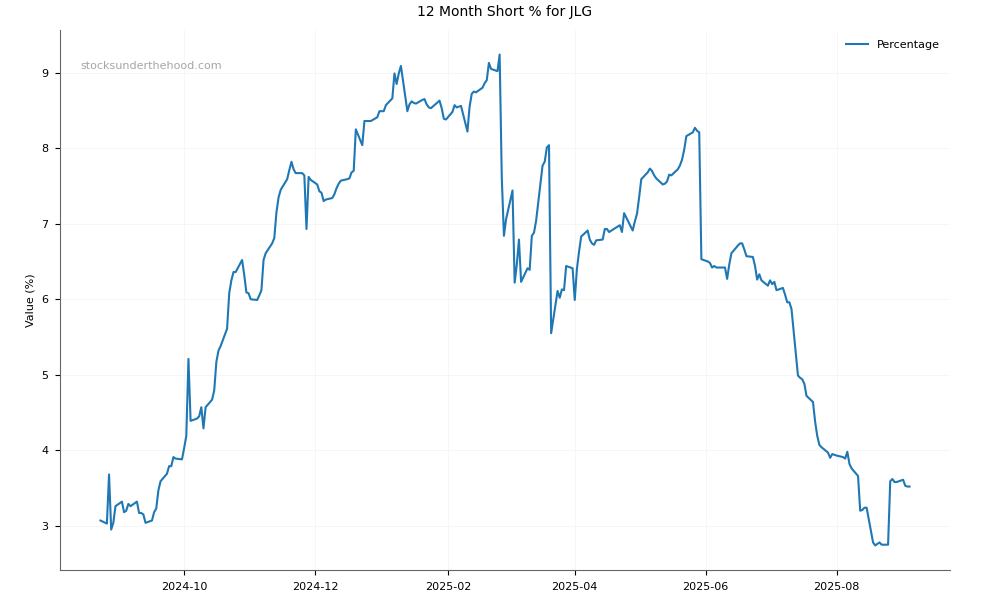
JLG Short Positions
Click HERE to understand why the above moving averages have been chosen.