Karoon Energy Ltd is an international oil and gas exploration and production company with assets primarily located in Brazil and Australia.
Ticker code: KAR
Sector: Energy | Industry: Oil & Gas E&P | Website: https://www.karoonenergy.com.au
Market Information
| Market Capitalisation | Enterprise Value | Shares Outstanding | Free Float [%] | Free Float Value |
|---|---|---|---|---|
| $1,188,616,421 | $1,413,116,421 | 731456259 | 92.59 | $1,100,484,811 |
Balance Sheet & Quality
| Equity | Cash | Debt | Return On Equity (ROE) | EBITDA 25 Margin [%] | Net Debt / Equity [%] | Rule of 40 |
|---|---|---|---|---|---|---|
| $990,391,783 | $112,100,000 | $336,600,000 | 16.2 | 58.1 | 22.7 | 50.1 |
Technicals & Short Data
| 3EMA Status | Volatility [%] | Value Traded Today | Average Daily Liquidity | Short [%] | Days To Cover |
|---|---|---|---|---|---|
| Negative | 3.7 | $18,701,332 | $6,502,327 | 6.77 | 12.4 |
Dividends
| Previous Dividend | Last Dividend | Franking [%] | Ex-Div Date | Gross Yield [%] |
|---|---|---|---|---|
| $0.050 | $0.024 | None | 2025-09-01 | 1.5 |
Price Performance Snapshot
| Last Traded Price | Change [%] | 1 Week [%] | 1 Month [%] | 3 Months [%] | 6 Months [%] | 12 Months [%] |
|---|---|---|---|---|---|---|
| $1.625 | 3.5 | 14.8 | -6.3 | -13.3 | 16.0 | 24.2 |
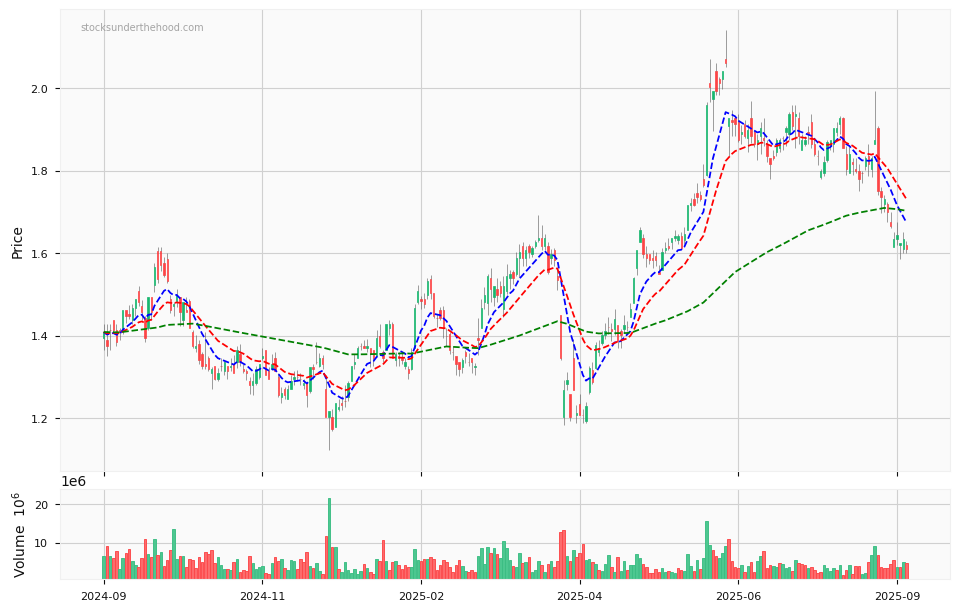
KAR Price Chart with Volume and 3EMA
KAR Short Positions

Click HERE to understand why the above moving averages have been chosen.