Kelsian Group Limited is Australia’s largest integrated multi-modal transport provider and tourism operator, delivering safe and intelligent transport solutions designed to improve the sustainability and liveability of the communities they serve.
Ticker code: KLS
Sector: Industrials | Industry: Railroads | Website: https://www.kelsian.com
Market Information
| Market Capitalisation | Enterprise Value | Shares Outstanding | Free Float [%] | Free Float Value |
|---|---|---|---|---|
| $1,325,383,172 | $2,212,222,148 | 271594906 | 56.2 | $744,841,850 |
Balance Sheet & Quality
| Equity | Cash | Debt | Return On Equity (ROE) | EBITDA 25 Margin [%] | Net Debt / Equity [%] | Rule of 40 |
|---|---|---|---|---|---|---|
| $958,186,819 | $182,784,000 | $1,069,622,976 | 7.0 | 12.8 | 92.6 | 21.9 |
Technicals & Short Data
| 3EMA Status | Volatility [%] | Value Traded Today | Average Daily Liquidity | Short [%] | Days To Cover |
|---|---|---|---|---|---|
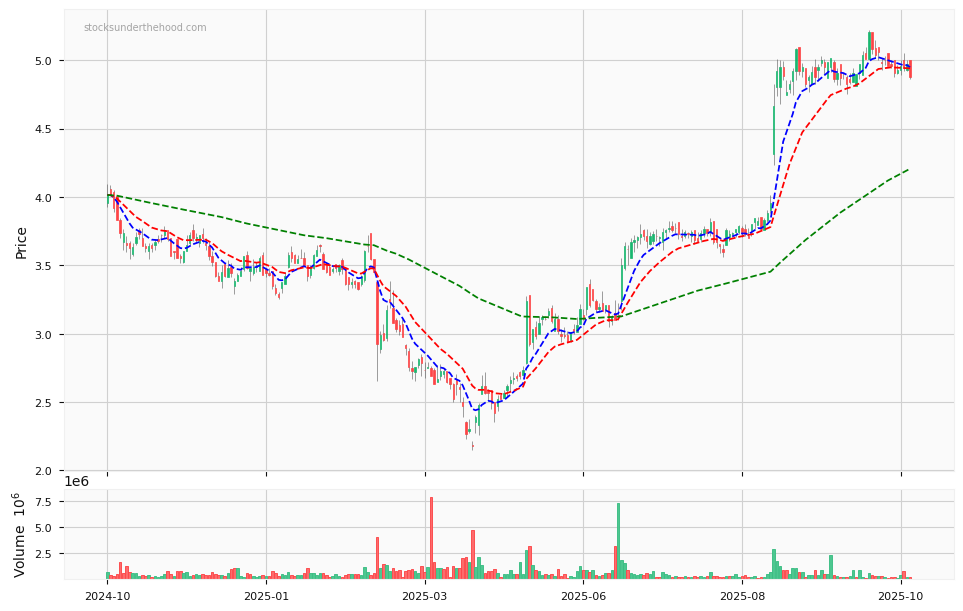
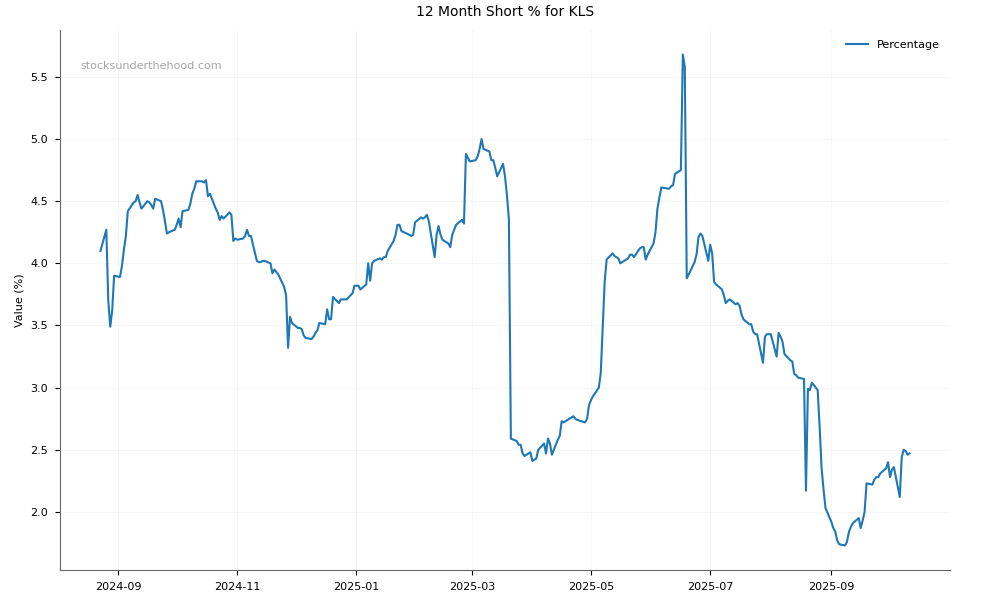
| Positive | 2.3 | $1,331,620 | $2,646,810 | 2.48 | 12.4 |
Dividends
| Previous Dividend | Last Dividend | Franking [%] | Ex-Div Date | Gross Yield [%] |
|---|---|---|---|---|
| $0.080 | $0.095 | 100.0 | 2025-09-15 | 2.8 |
Price Performance Snapshot
| Last Traded Price | Change [%] | 1 Week [%] | 1 Month [%] | 3 Months [%] | 6 Months [%] | 12 Months [%] |
|---|---|---|---|---|---|---|
| $4.880 | -1.8 | -1.0 | 1.0 | 29.6 | 89.9 | 30.6 |
KLS Price Chart with Volume and 3EMA
KLS Short Positions
Click HERE to understand why the above moving averages have been chosen.